A Collection of Node.js Debugging Methods
This article discusses several popular Node.js debugging methods, including Chrome, VS Code, Atom, and WebStorm.
Chrome:
Advantages
- No dependency on a specific editor;
- No configuration required;
- Integrated into Node.js by default, officially recommended;
- Consistent with frontend code debugging tools;
- Powerful DevTools
Disadvantages
- Cannot set breakpoints directly in source files
VS Code:
Advantages
- Can set breakpoints directly in source files
Disadvantages
- Requires some configuration
WebStorm:
Advantages
- Can set breakpoints directly in source files
Disadvantages
- Requires some configuration
Atom:
Advantages
- Can set breakpoints directly in source files
Disadvantages
- Less capable than VS Code
Personal recommendation: If you already use VS Code or WebStorm, I suggest continuing to use their respective Node.js debugging features. If you use Atom, Sublime, or other editors that are less convenient for debugging, I recommend using Chrome for debugging.
Chrome Debugging Configuration
Step 1: Install nodemon to watch for file changes and restart the Node service
$> npm install nodemon -g
Step 2: Start debugging with the –inspect flag
$> NODE_ENV=development nodemon --inspect -w config -w server -x node server/server.js
Notes:
- NODE_ENV=development // Pass environment variables
- –inspect // Debug with Chrome. When debugging multiple Node services simultaneously, you can set a port to avoid conflicts: –inspect=9291
- -w config -w server // Watch the config and server directories. When files in these directories change, the service automatically restarts
- -x node // Defaults to node, can be omitted. When necessary, can be configured as babel-node: -x babel-node
- server/server.js // Node project entry file
Step 3: Start the frontend dev server (if applicable)
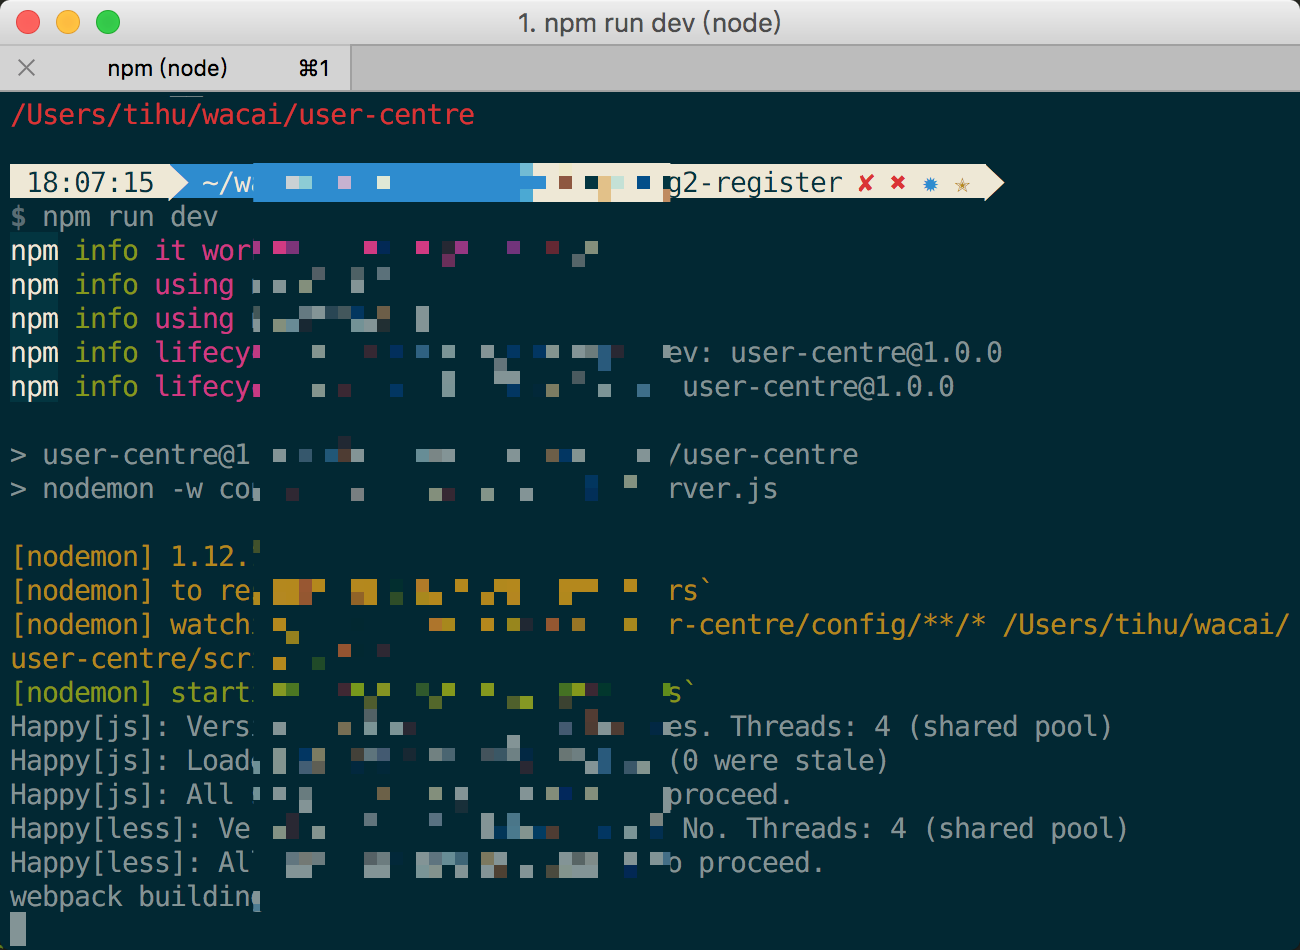
Step 4: It’s recommended to configure the above commands as npm scripts (in which case you can install nodemon locally in the project):
1 | "scripts": { |
Step 5: Open Chrome and open DevTools. If your Chrome is new enough (version 60+), you can click the Node.js icon shown below to enter the debugger
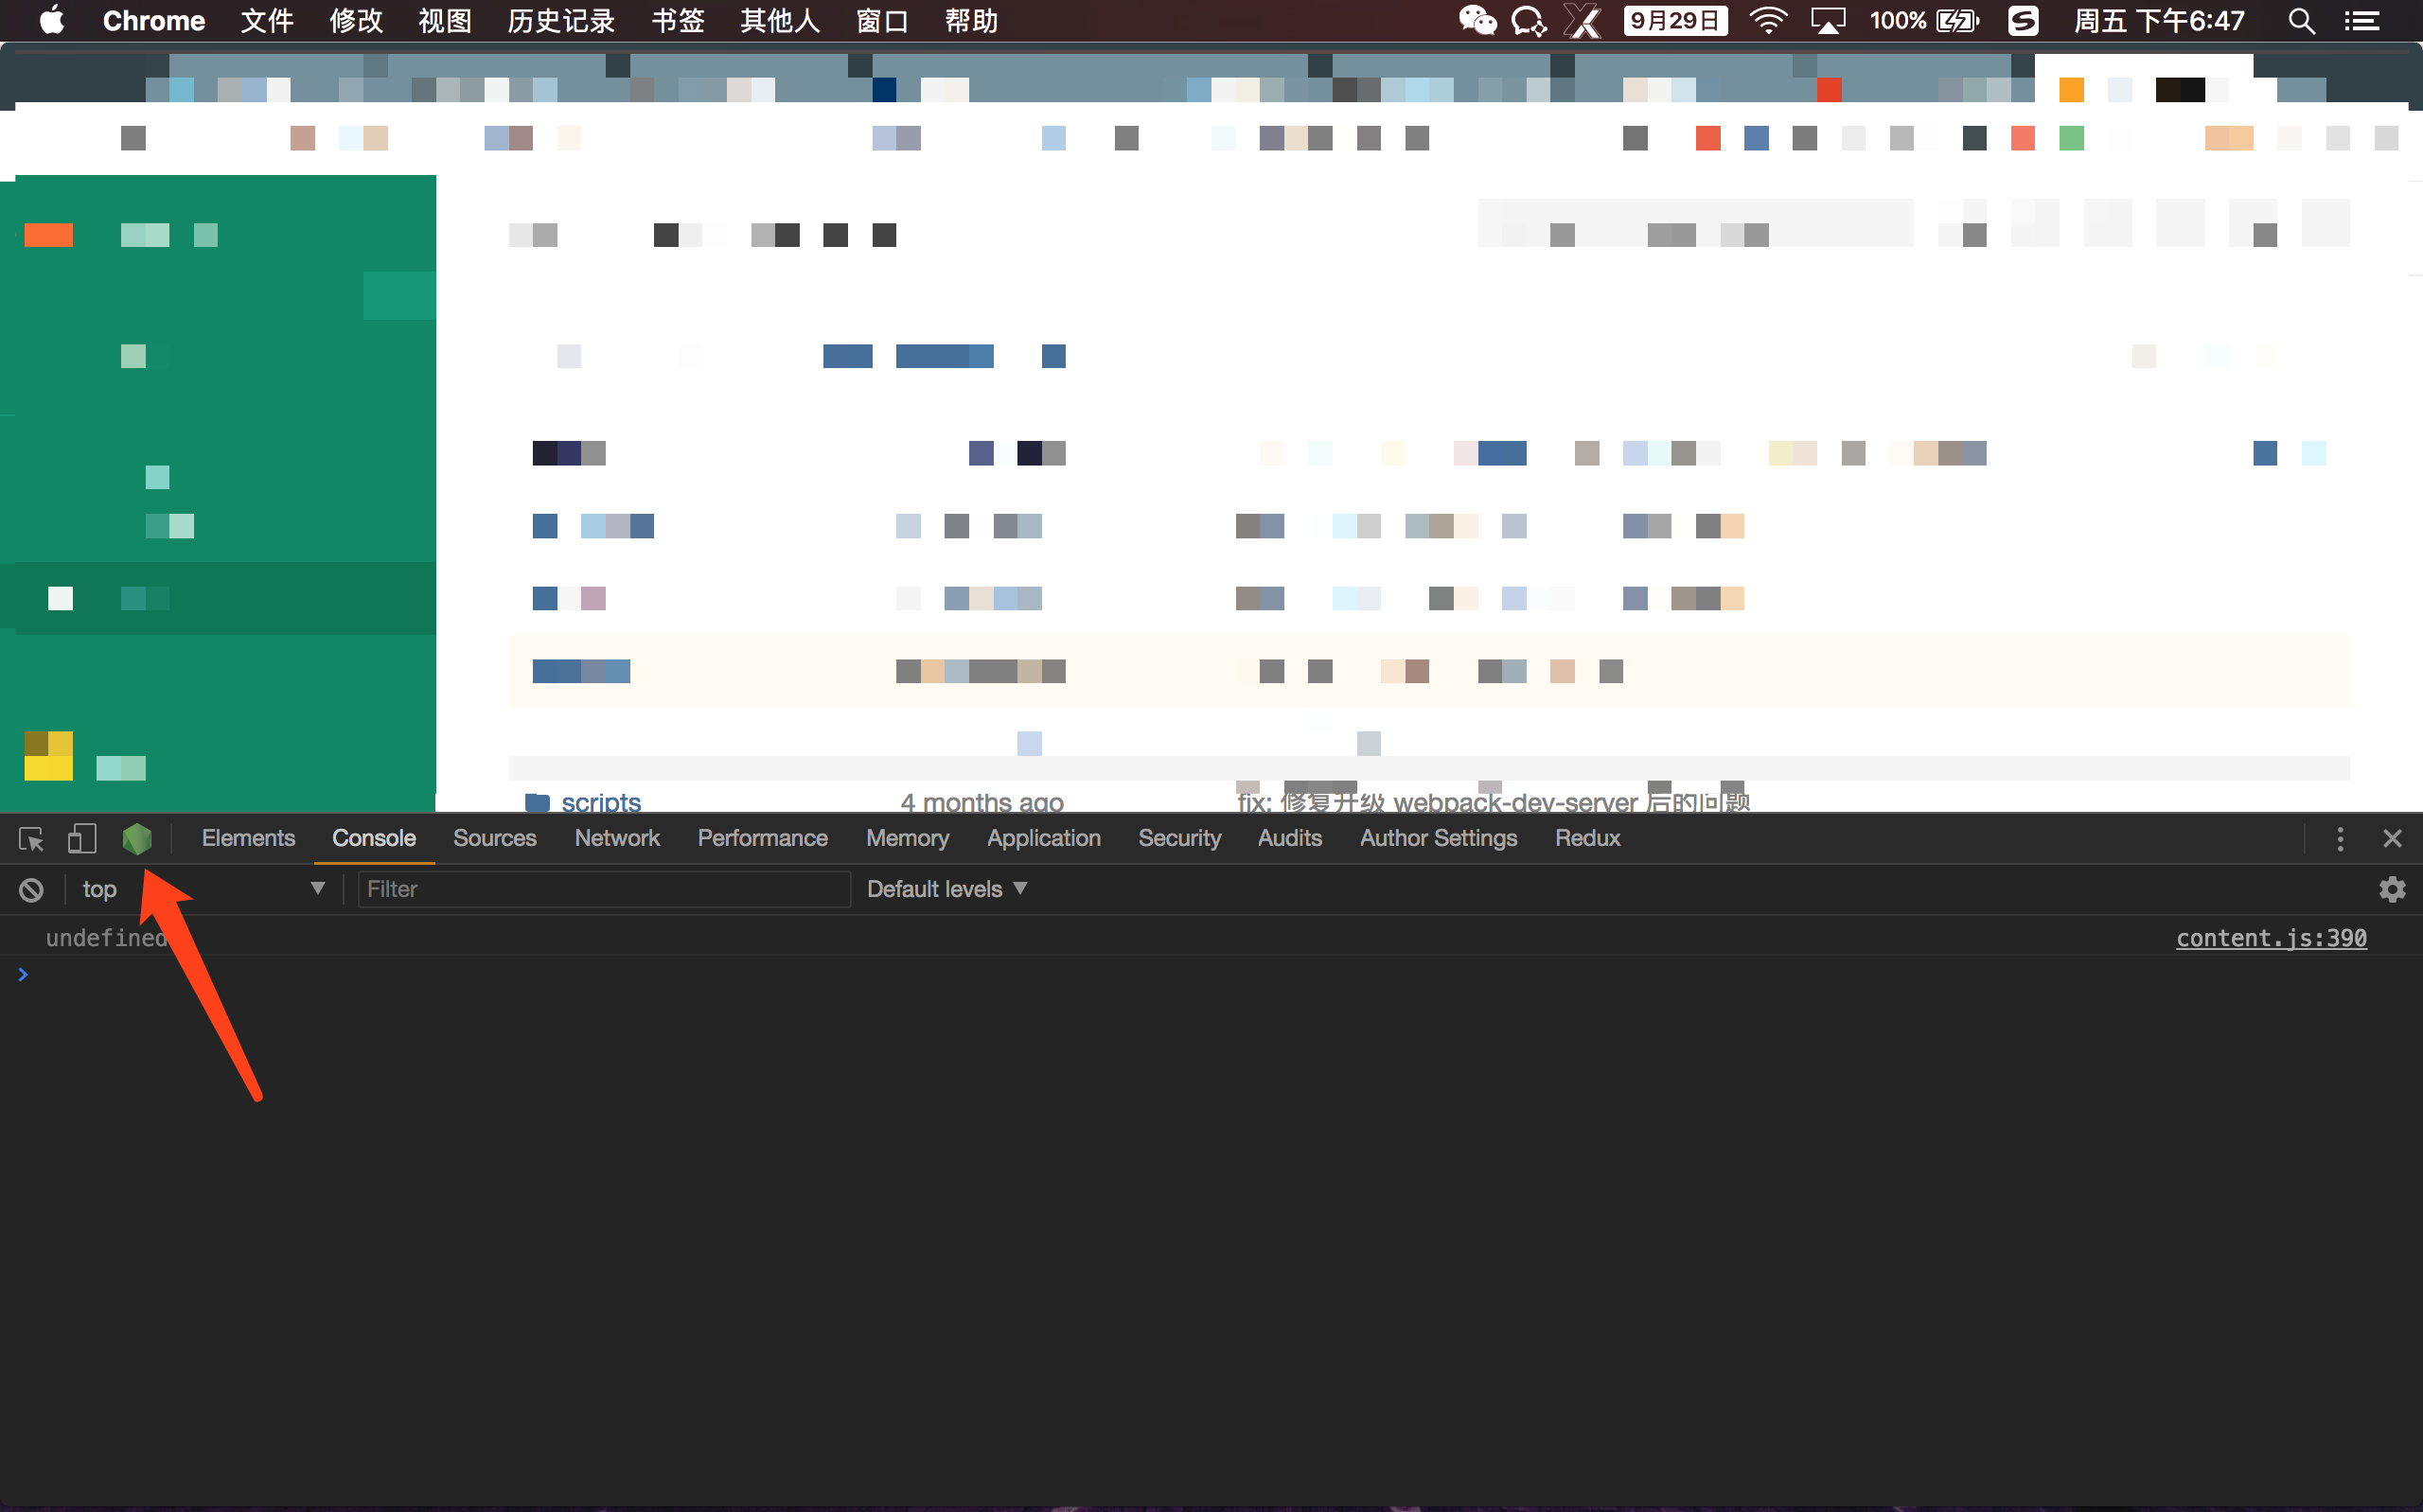
Step 6: If your current Chrome version doesn’t support this, please update it, or use the plugin NIM
VS Code Debugging Configuration
Step 1: Open the project directory
Step 2: Switch to the Debug tab:
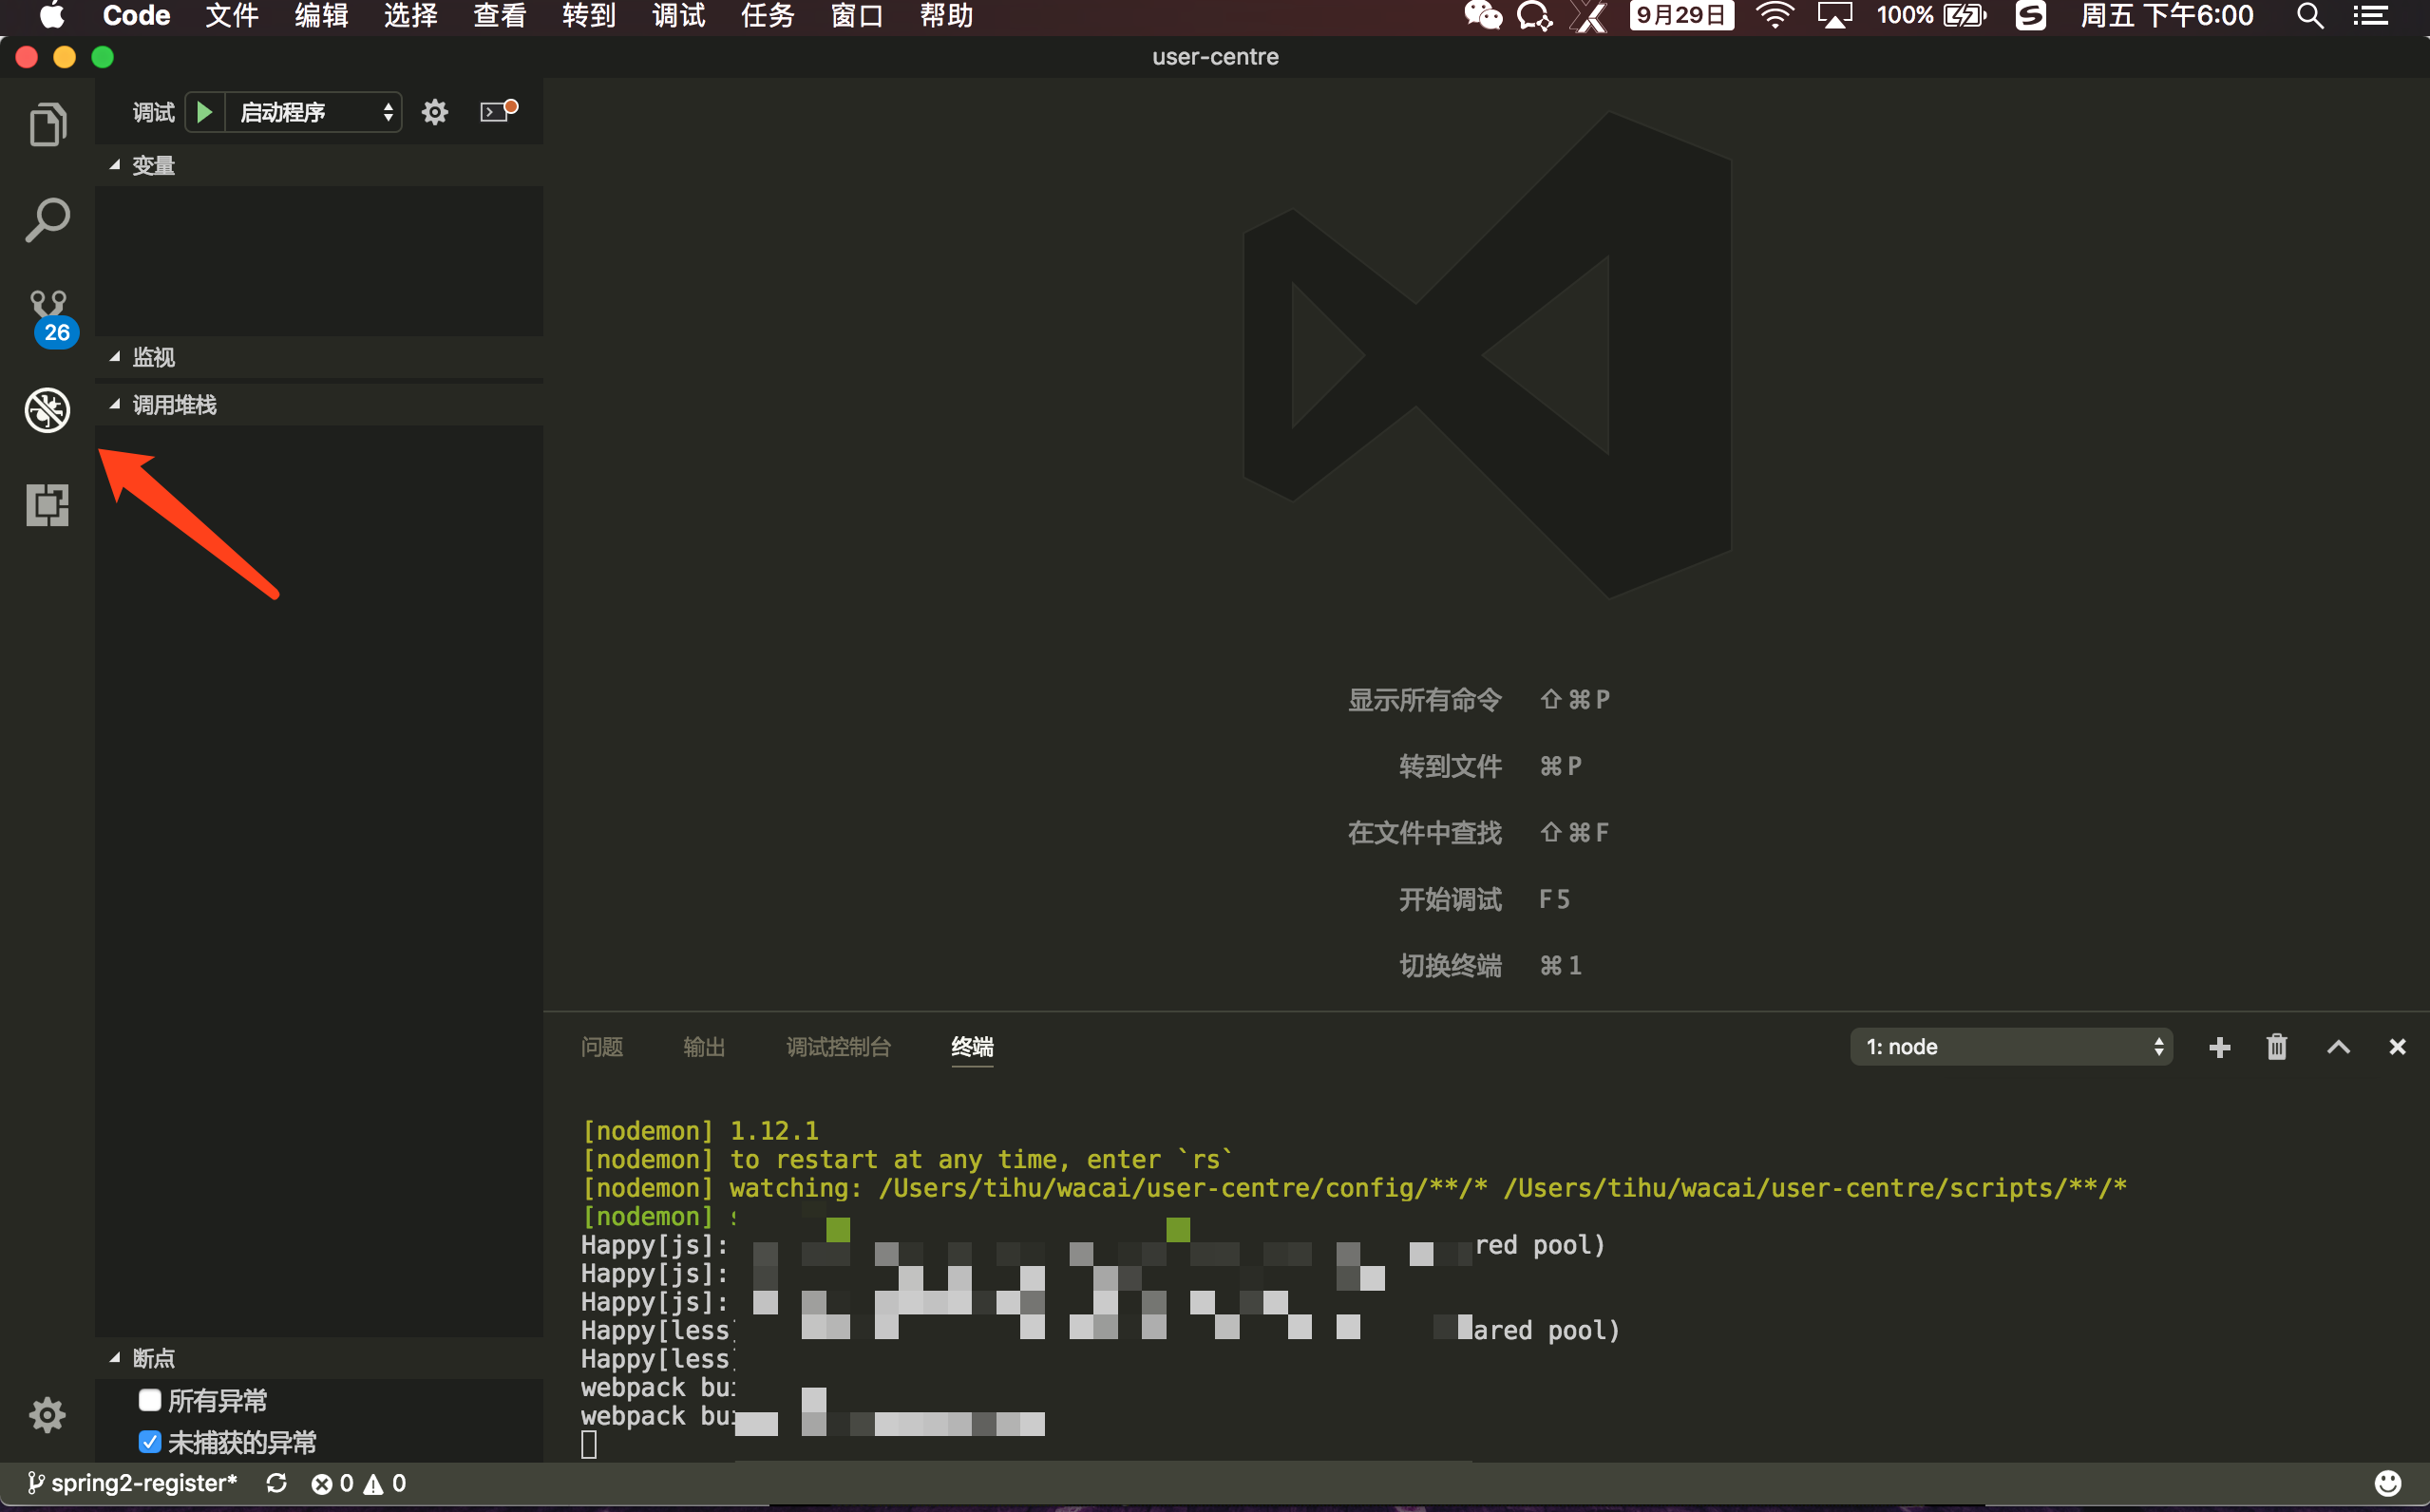
Step 3: Open the launch.json file
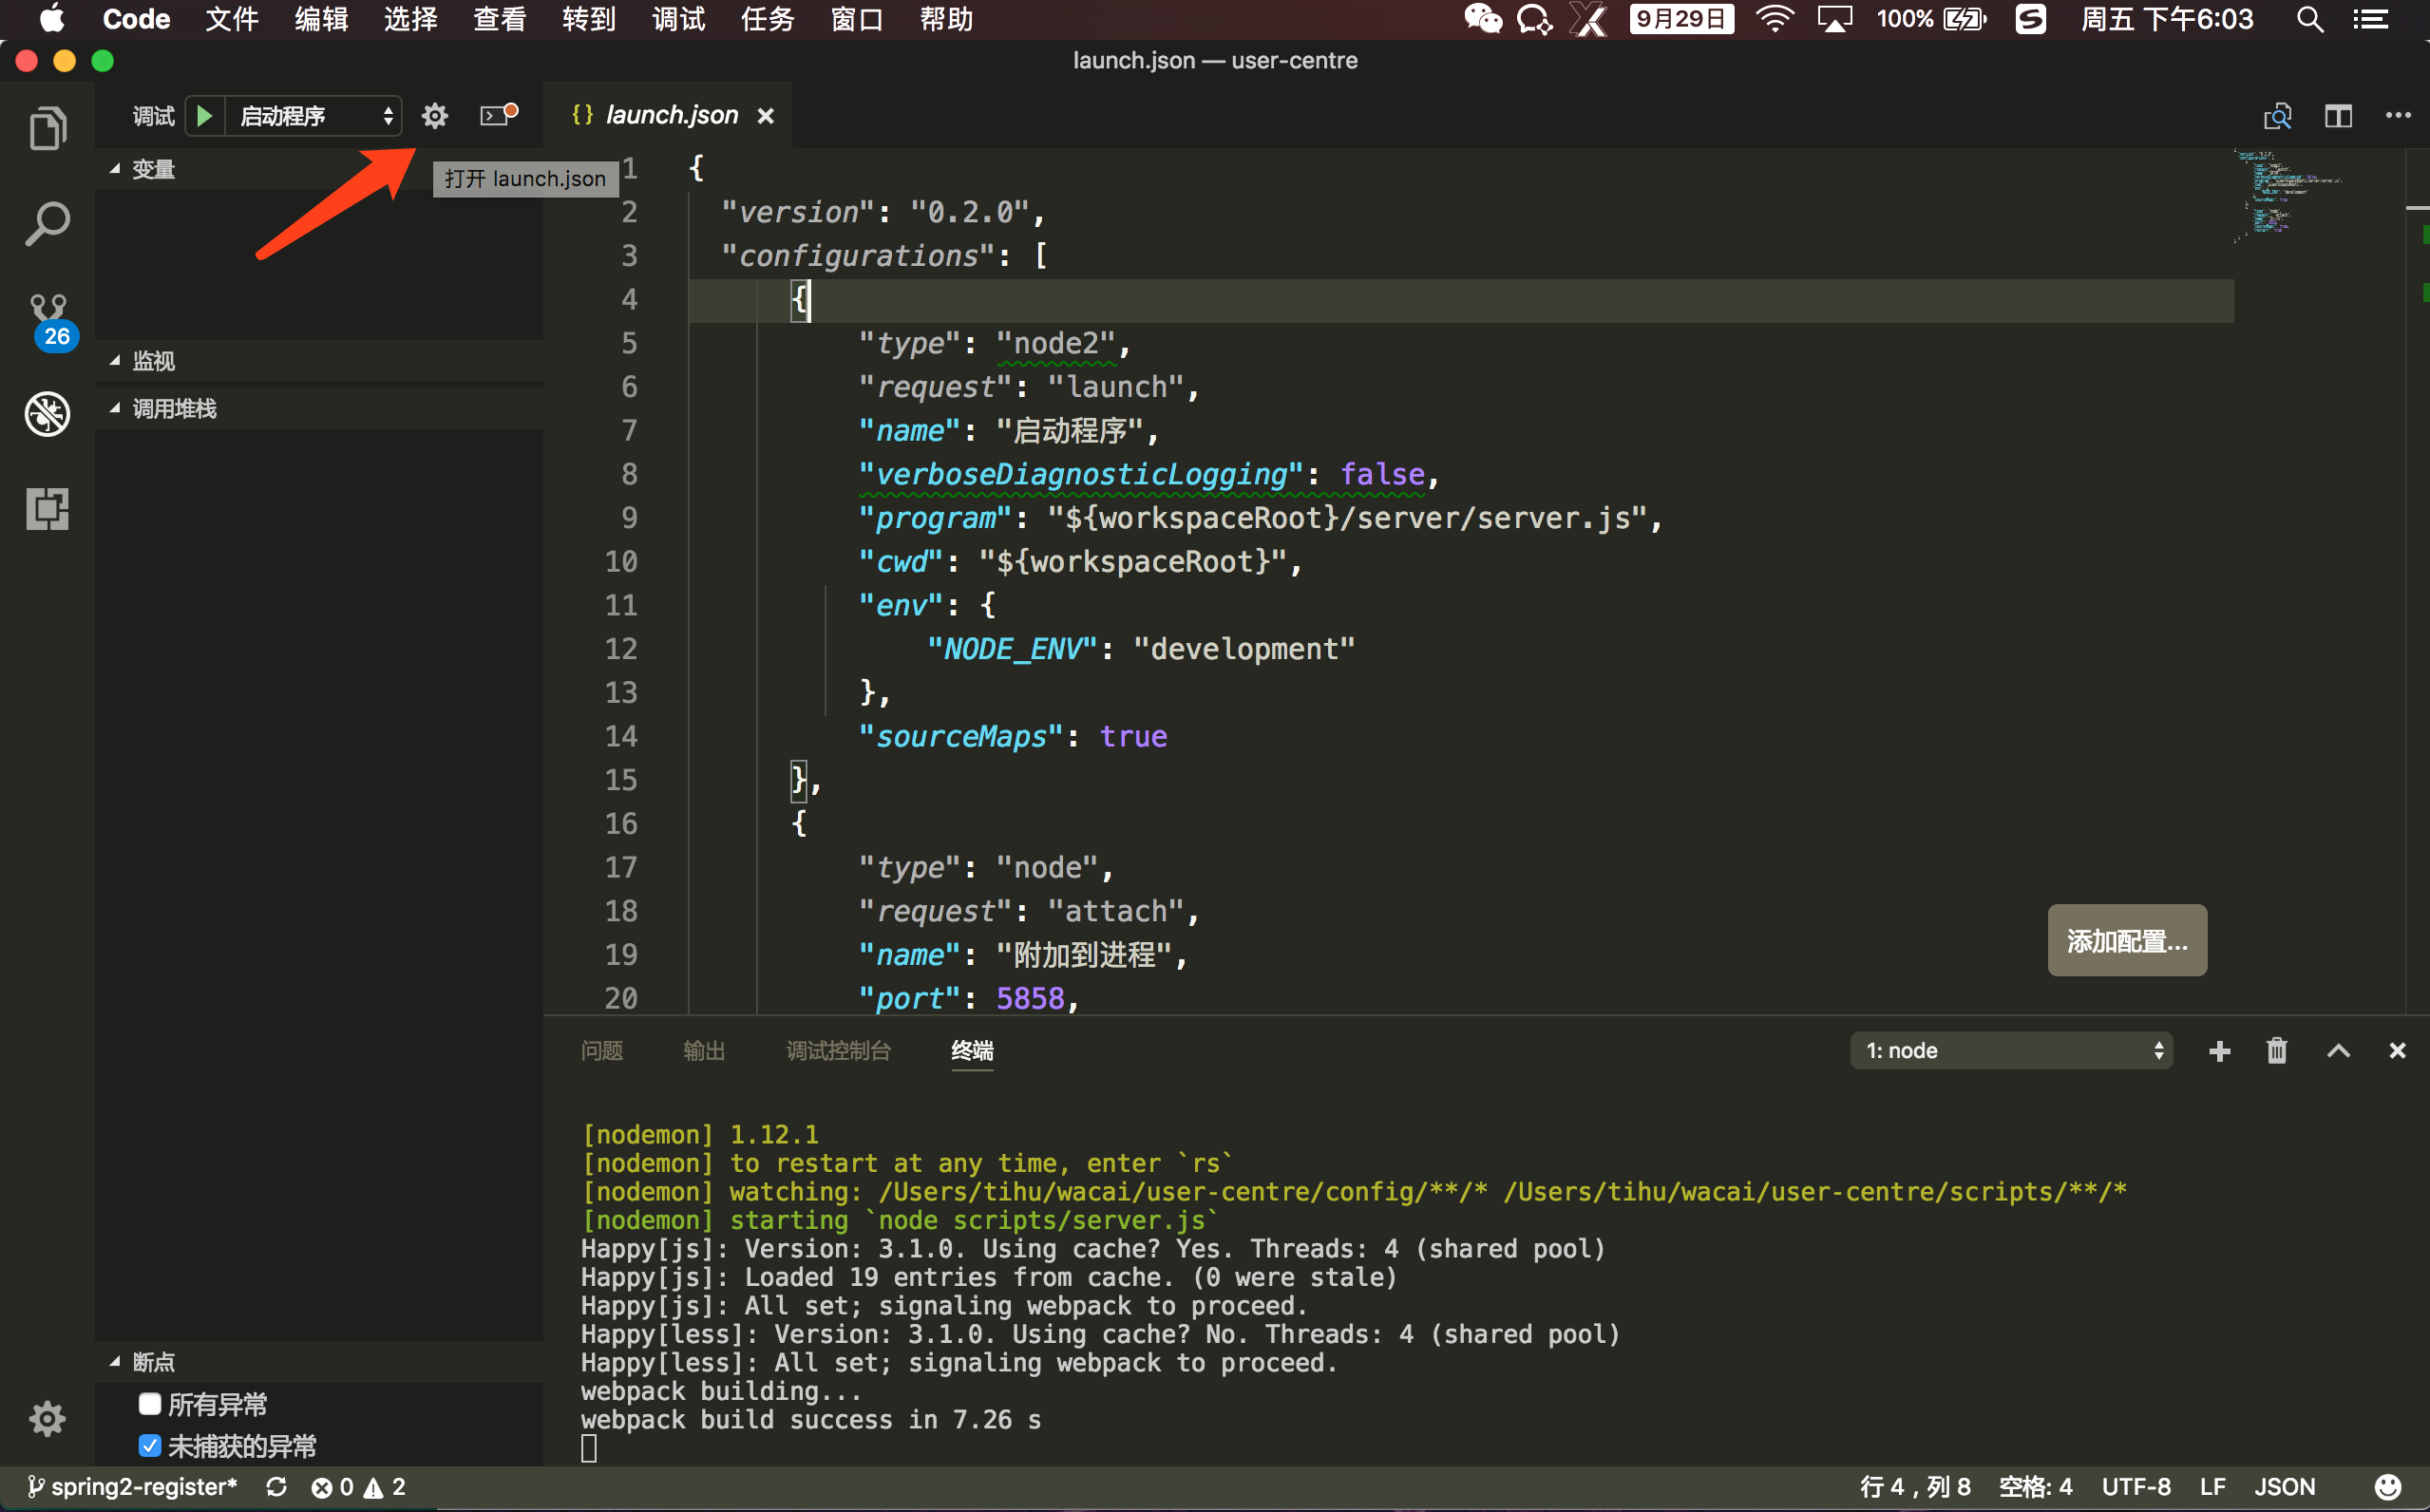
Step 4: Configure launch.json
1 | { |
Step 5: Start the frontend dev server (if applicable)
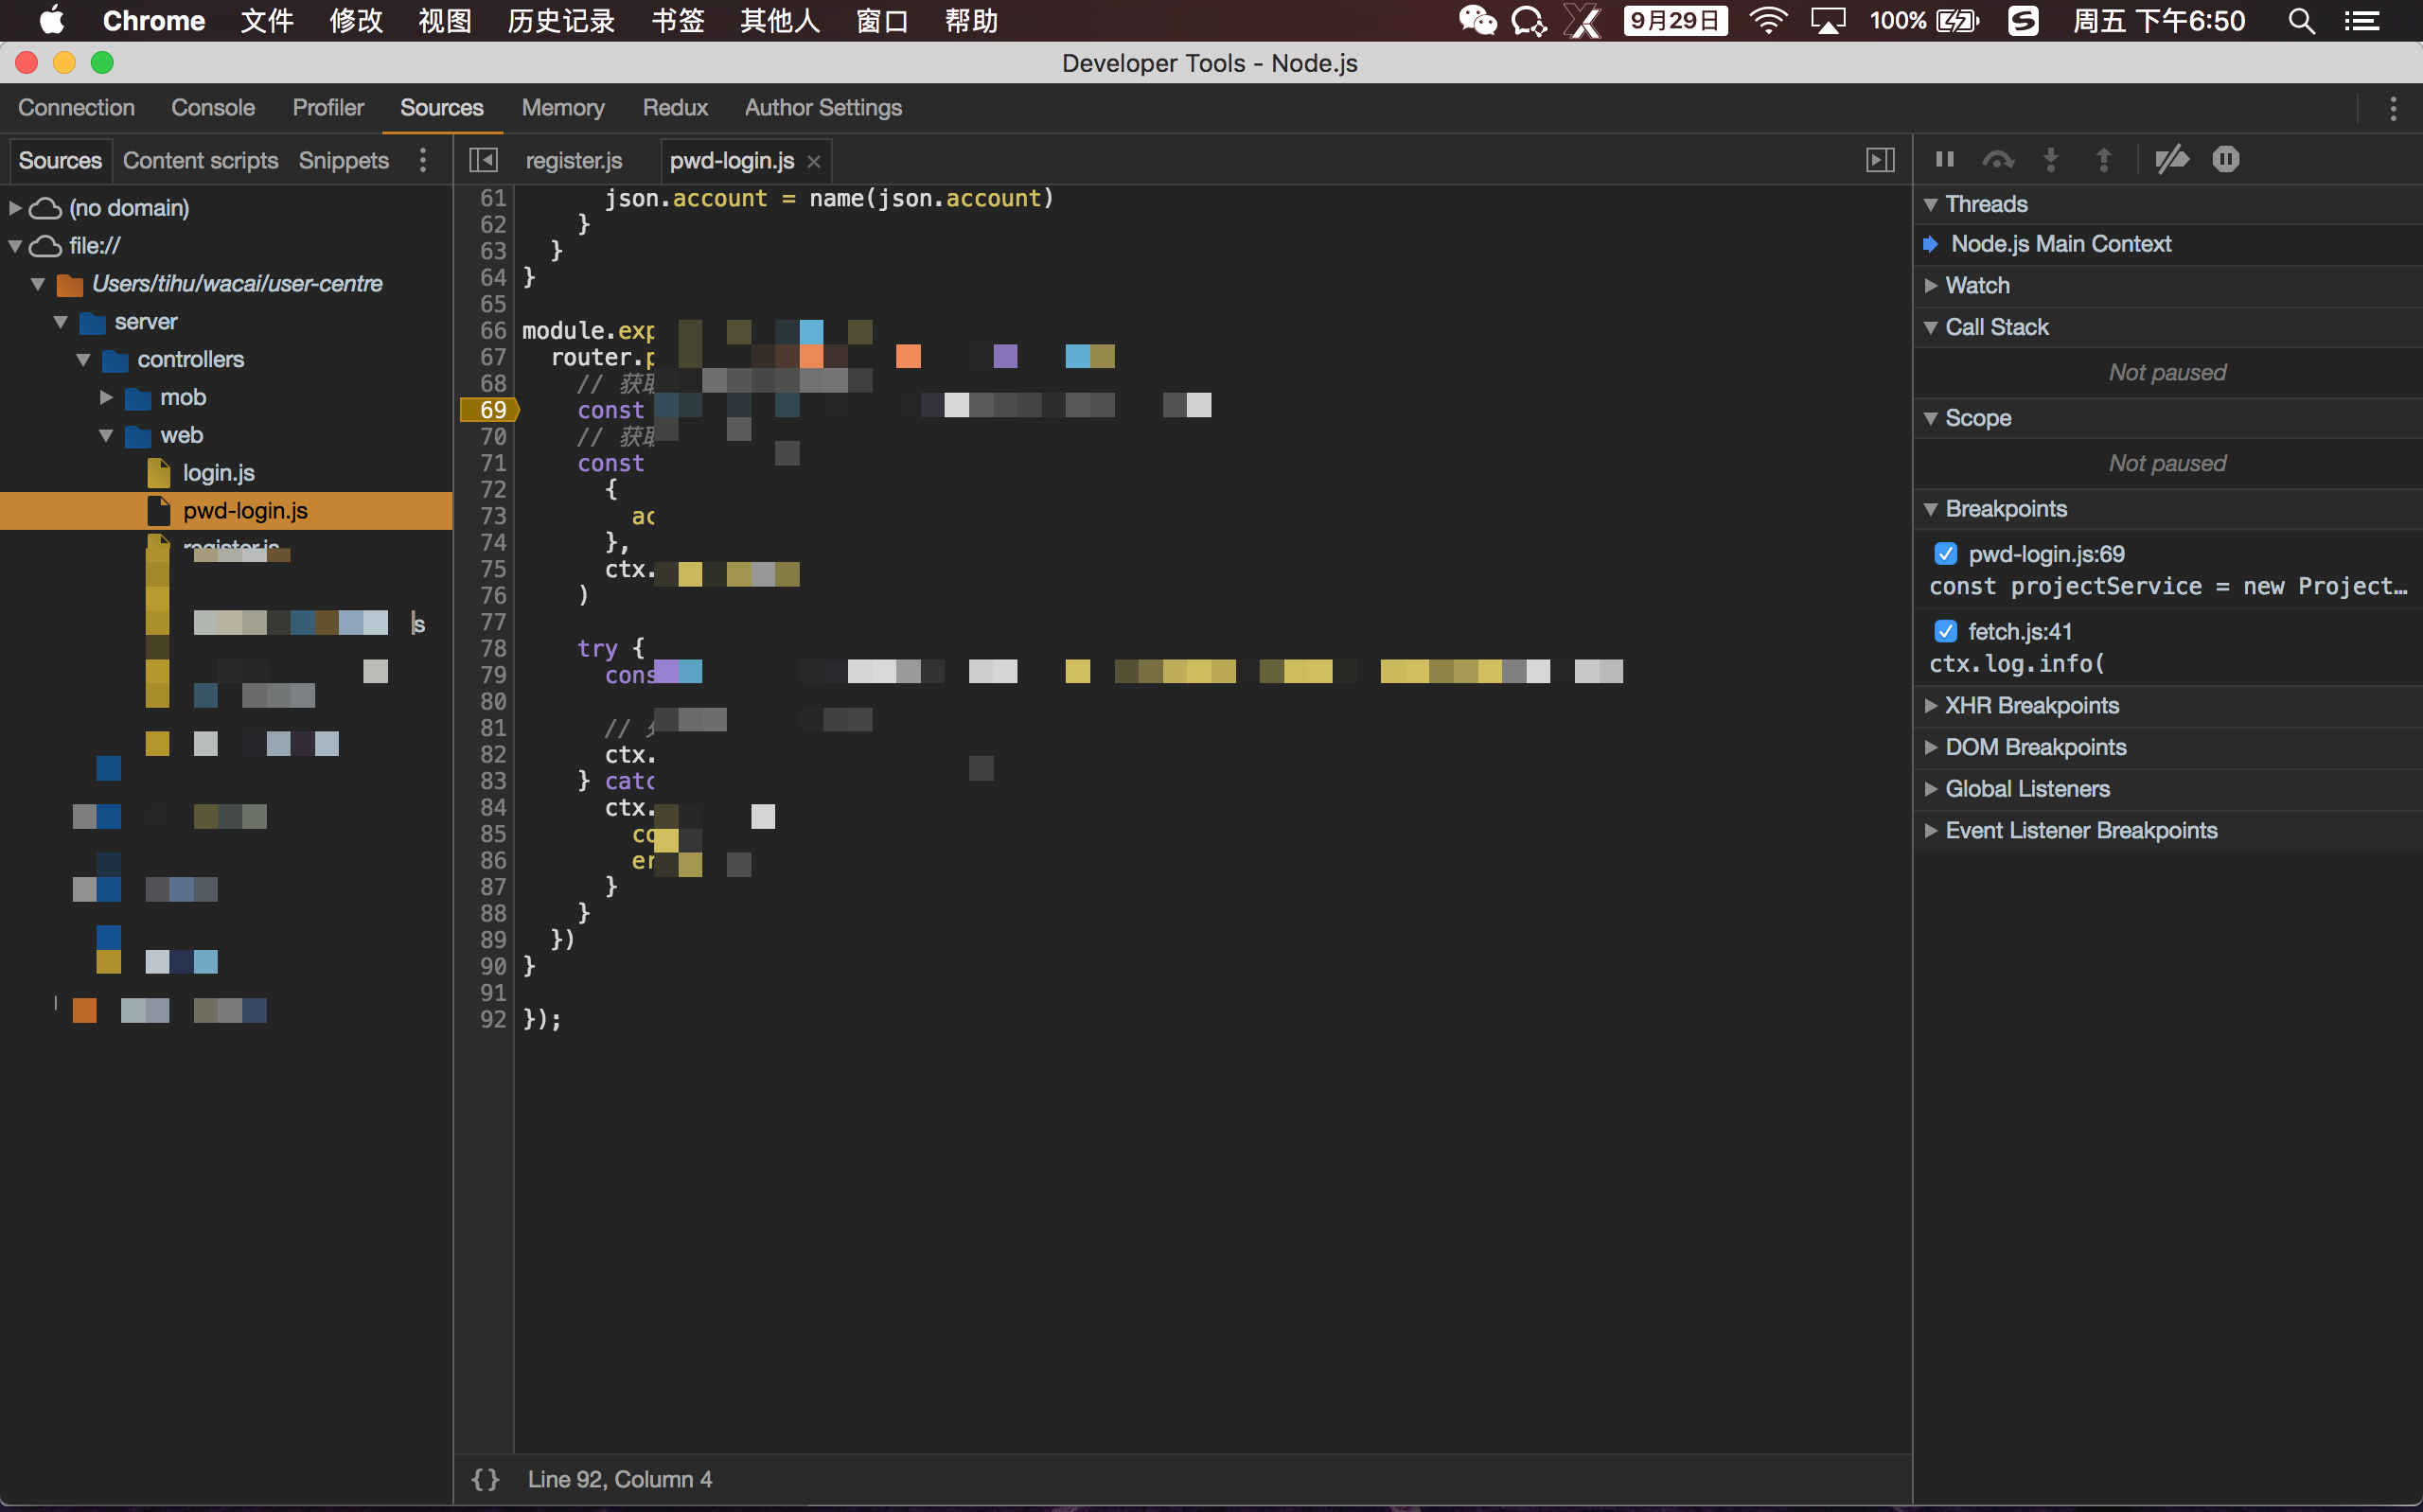
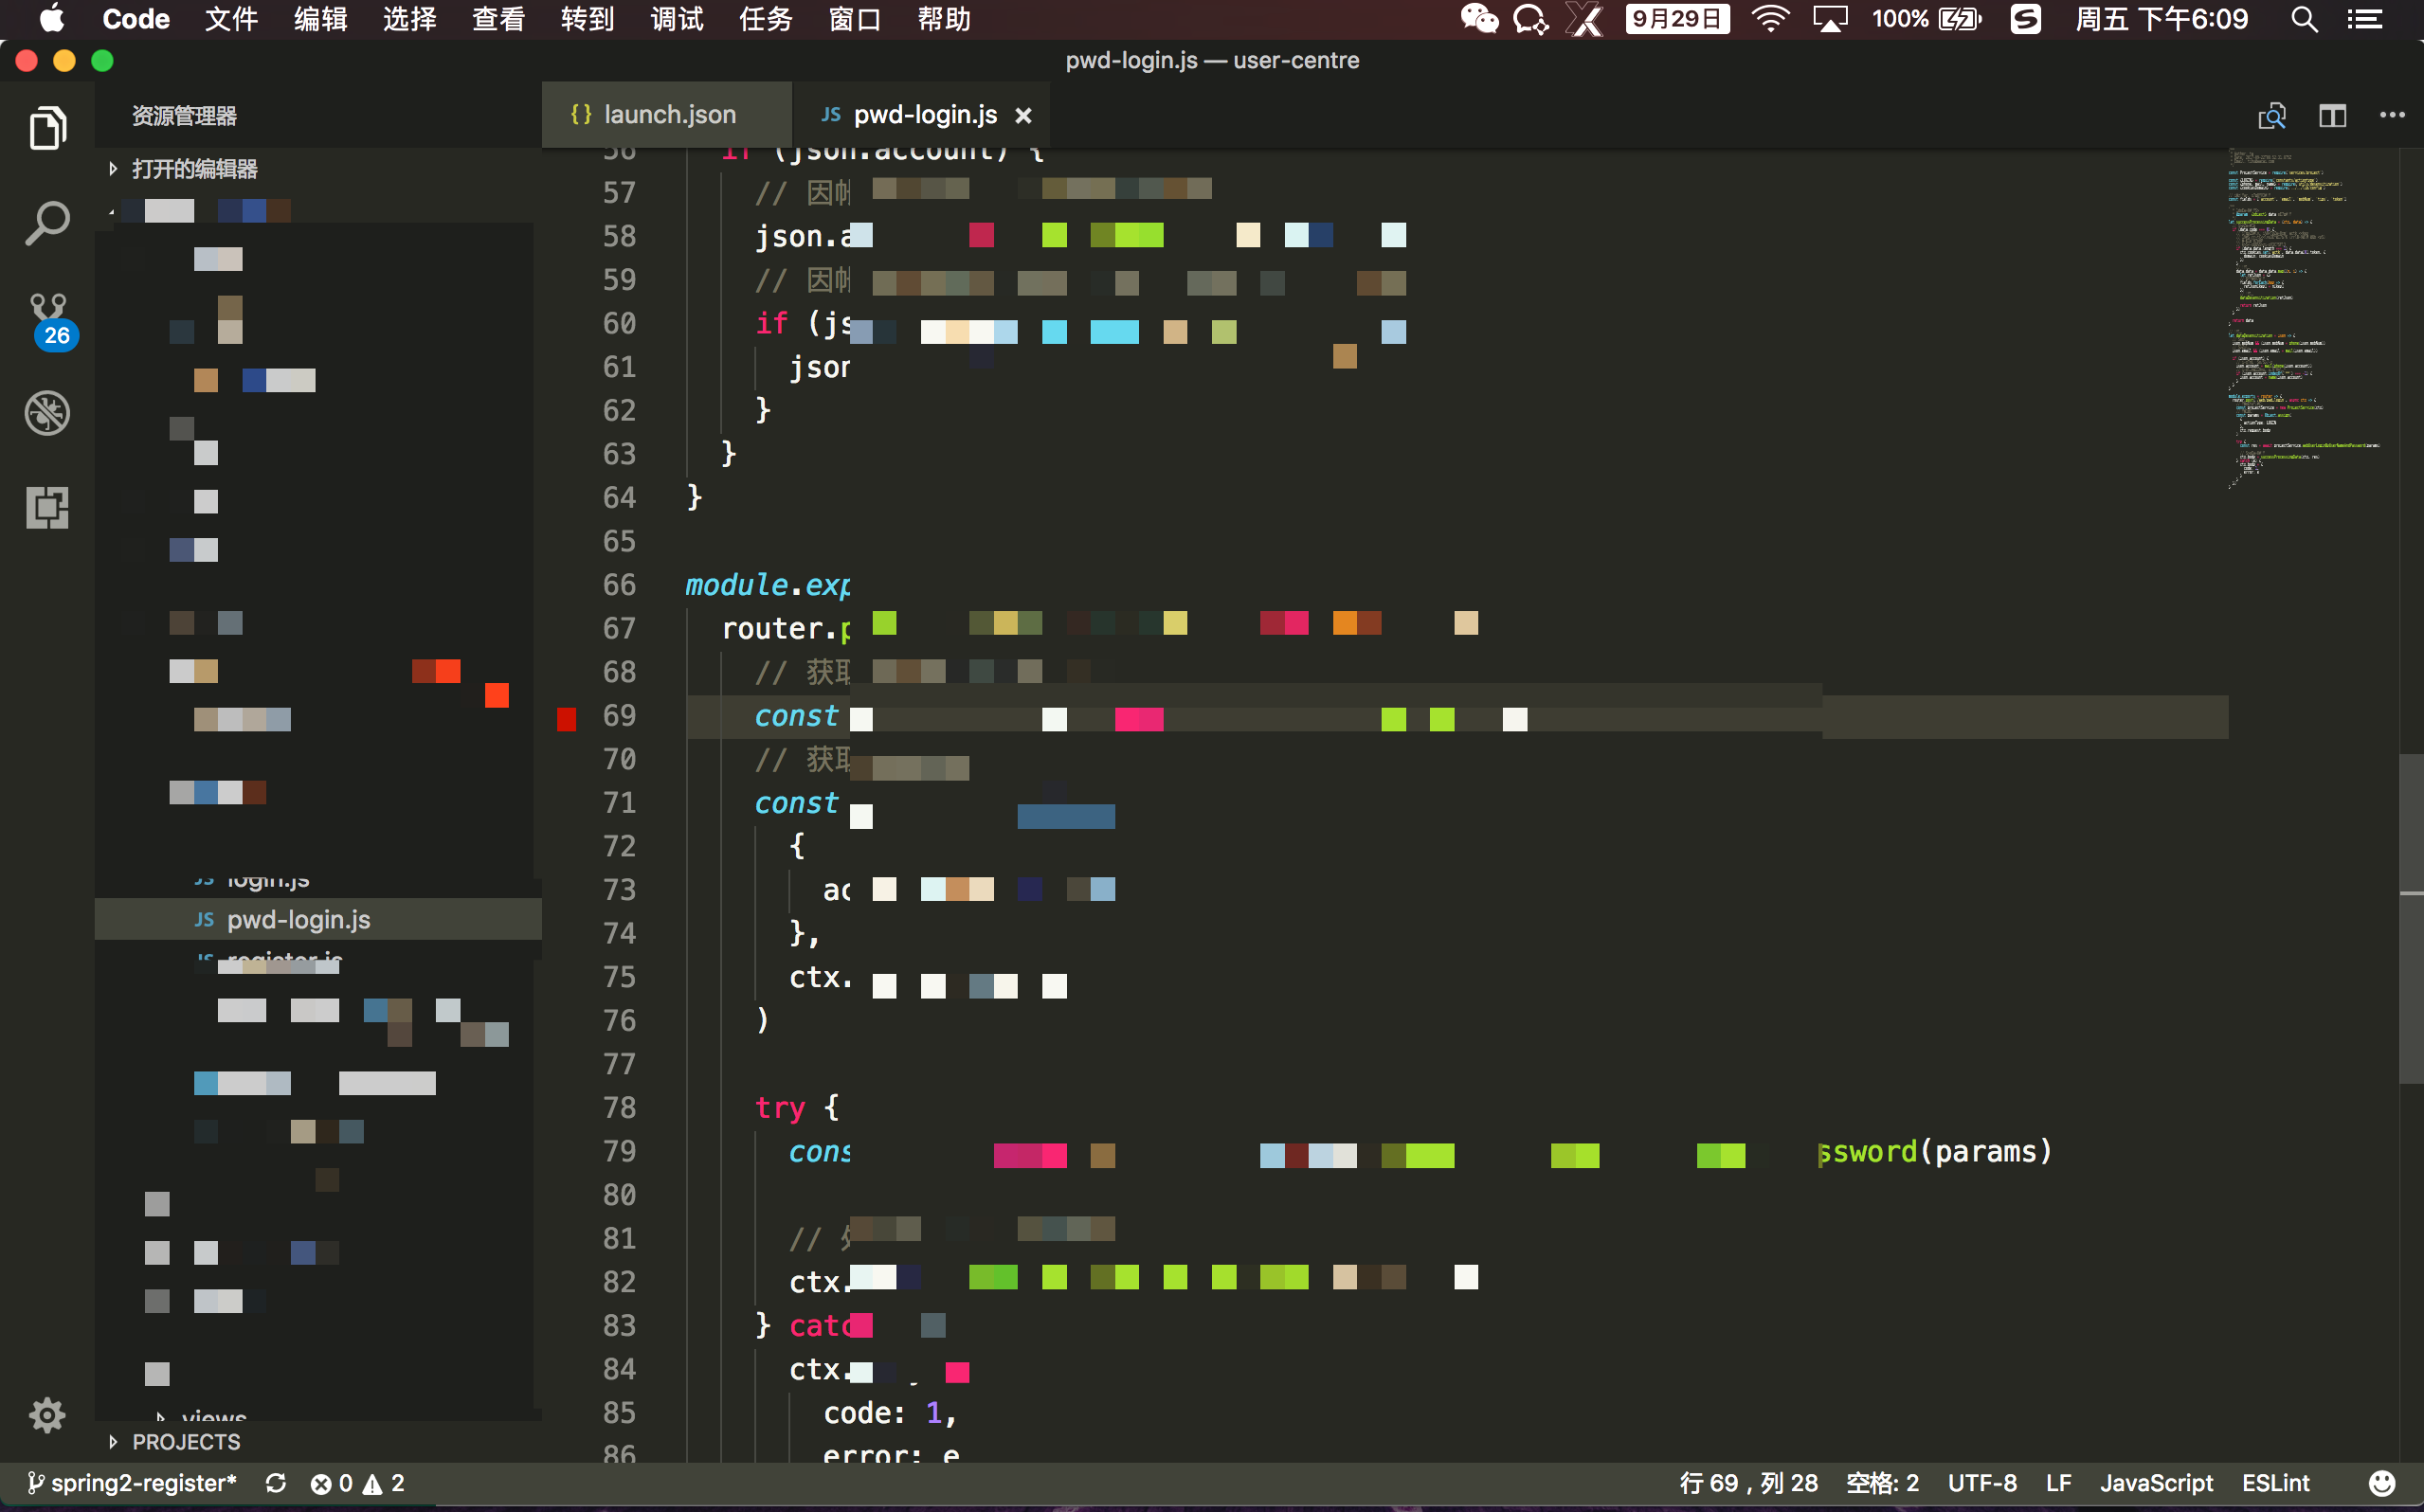
Step 6: Open a source file in VS Code and click to the left of the line number to add a breakpoint
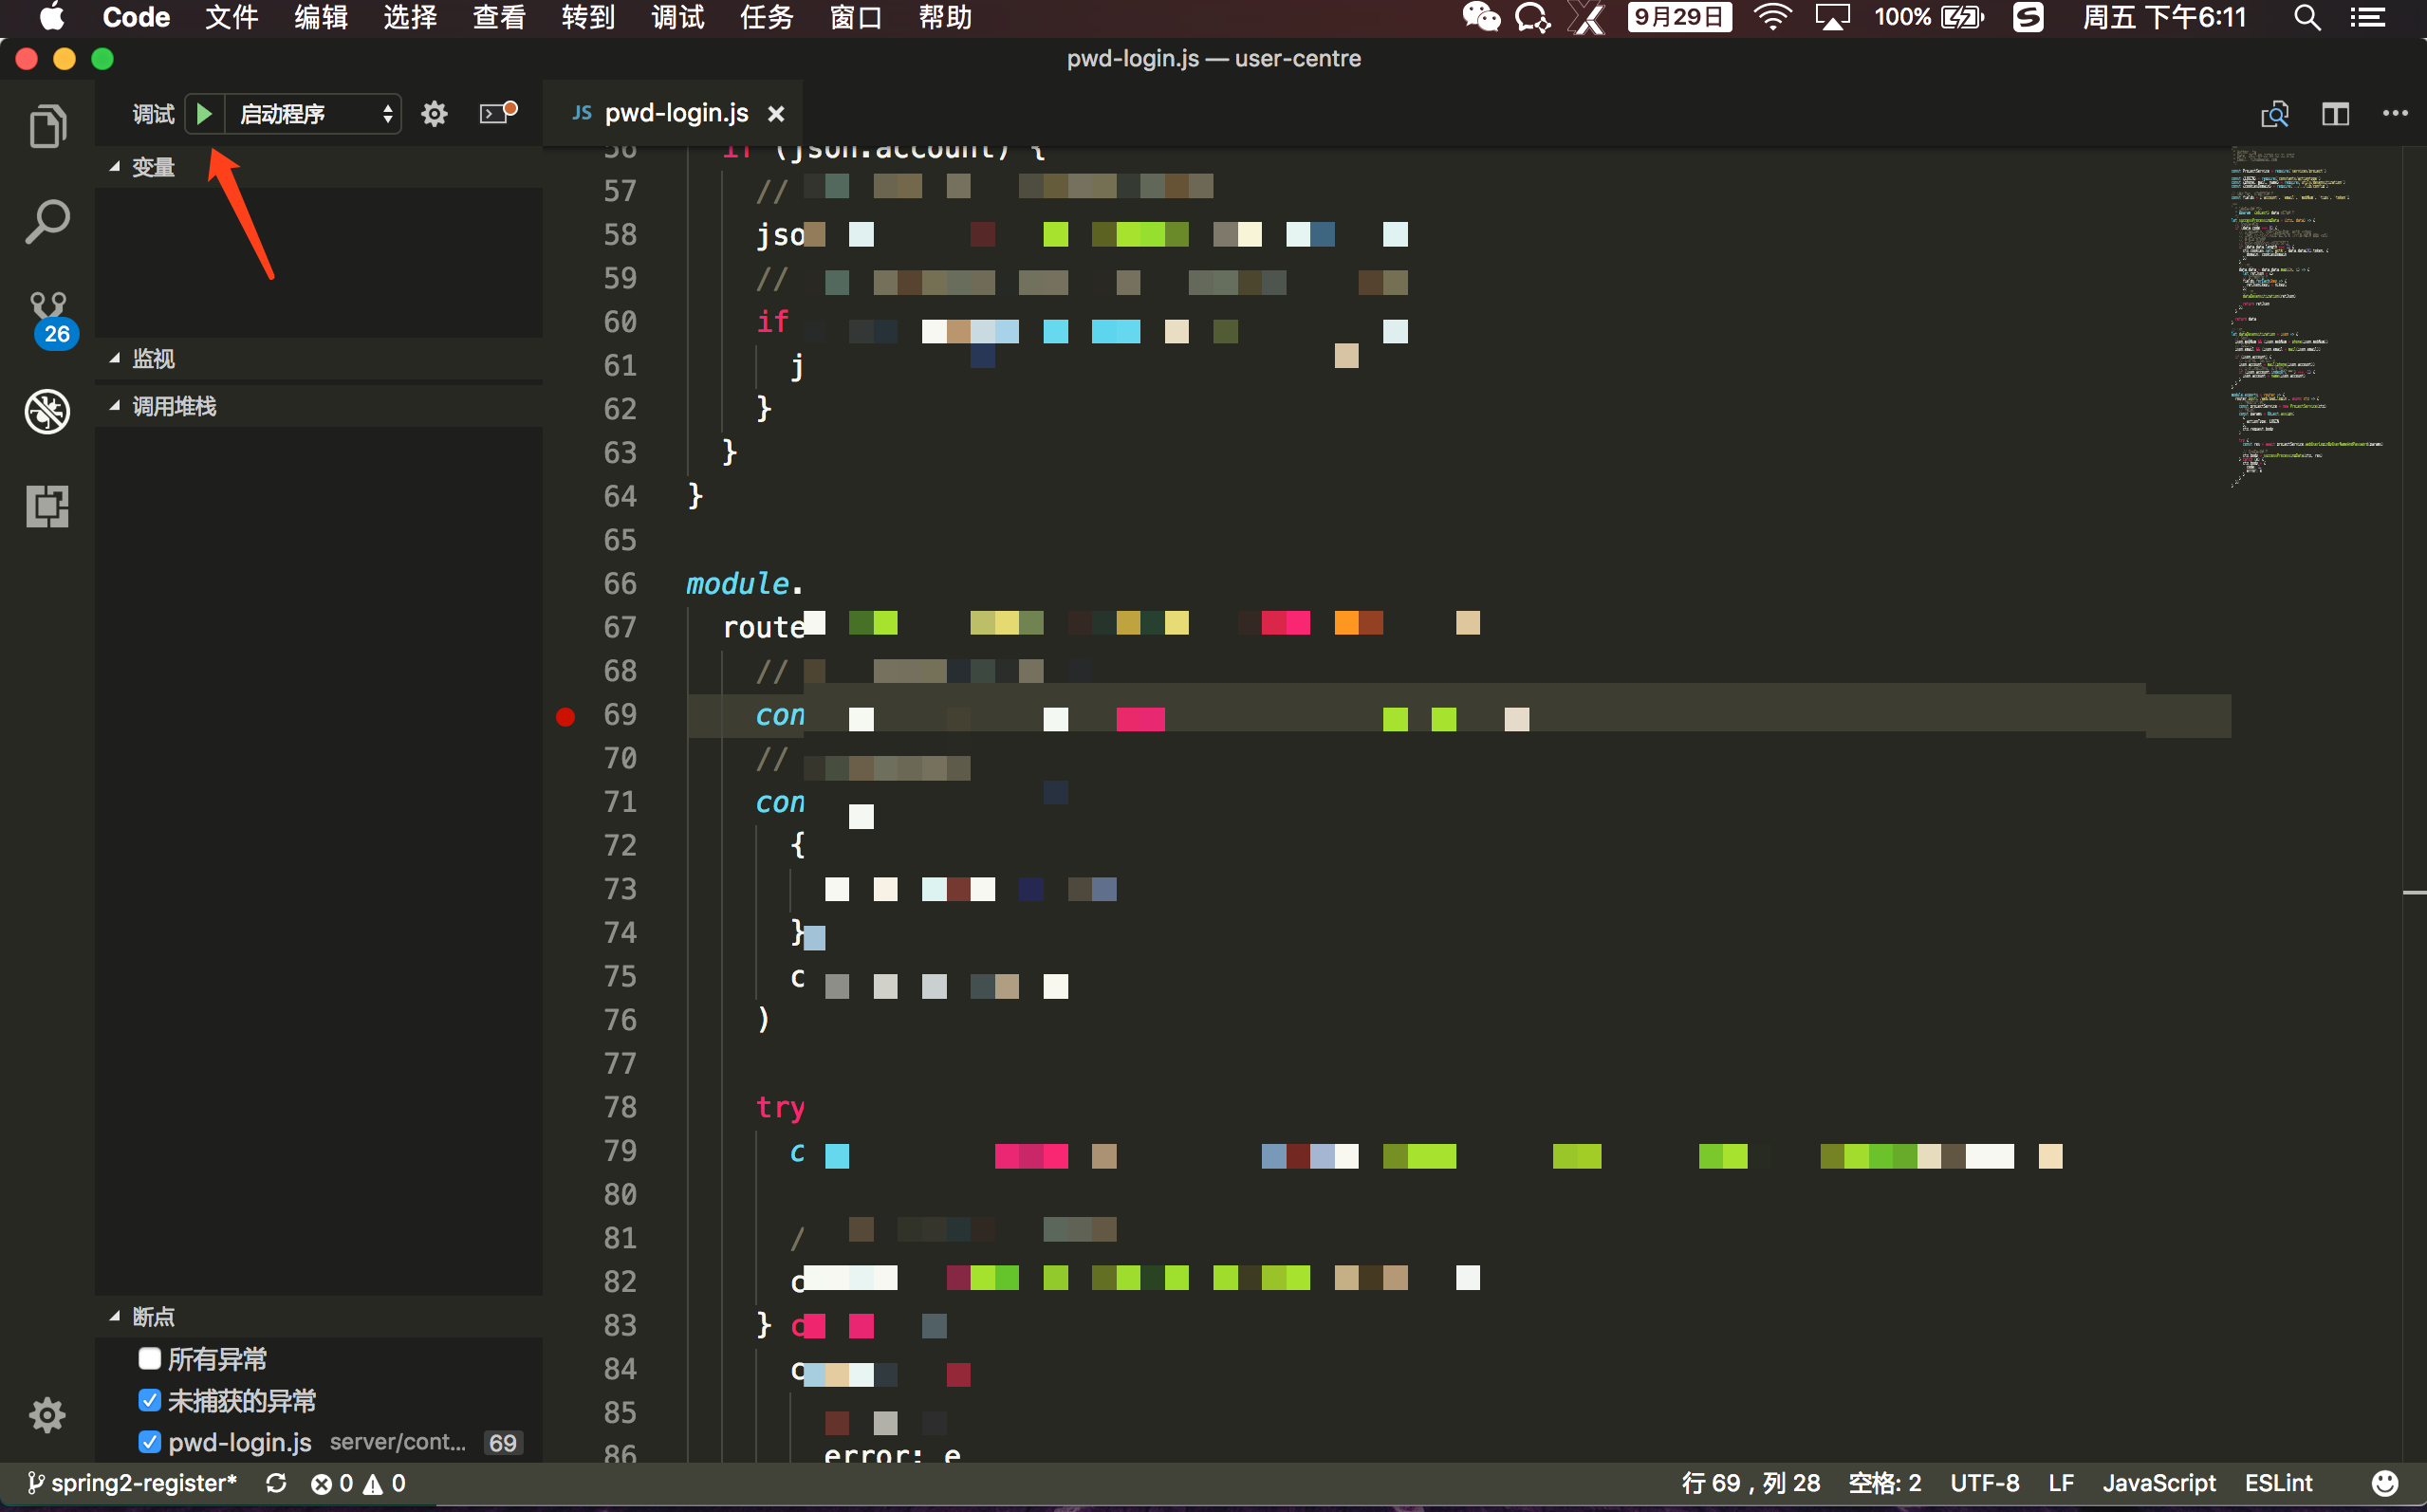
Step 7: Switch back to the Debug tab and start the Node.js service to begin debugging
WebStorm
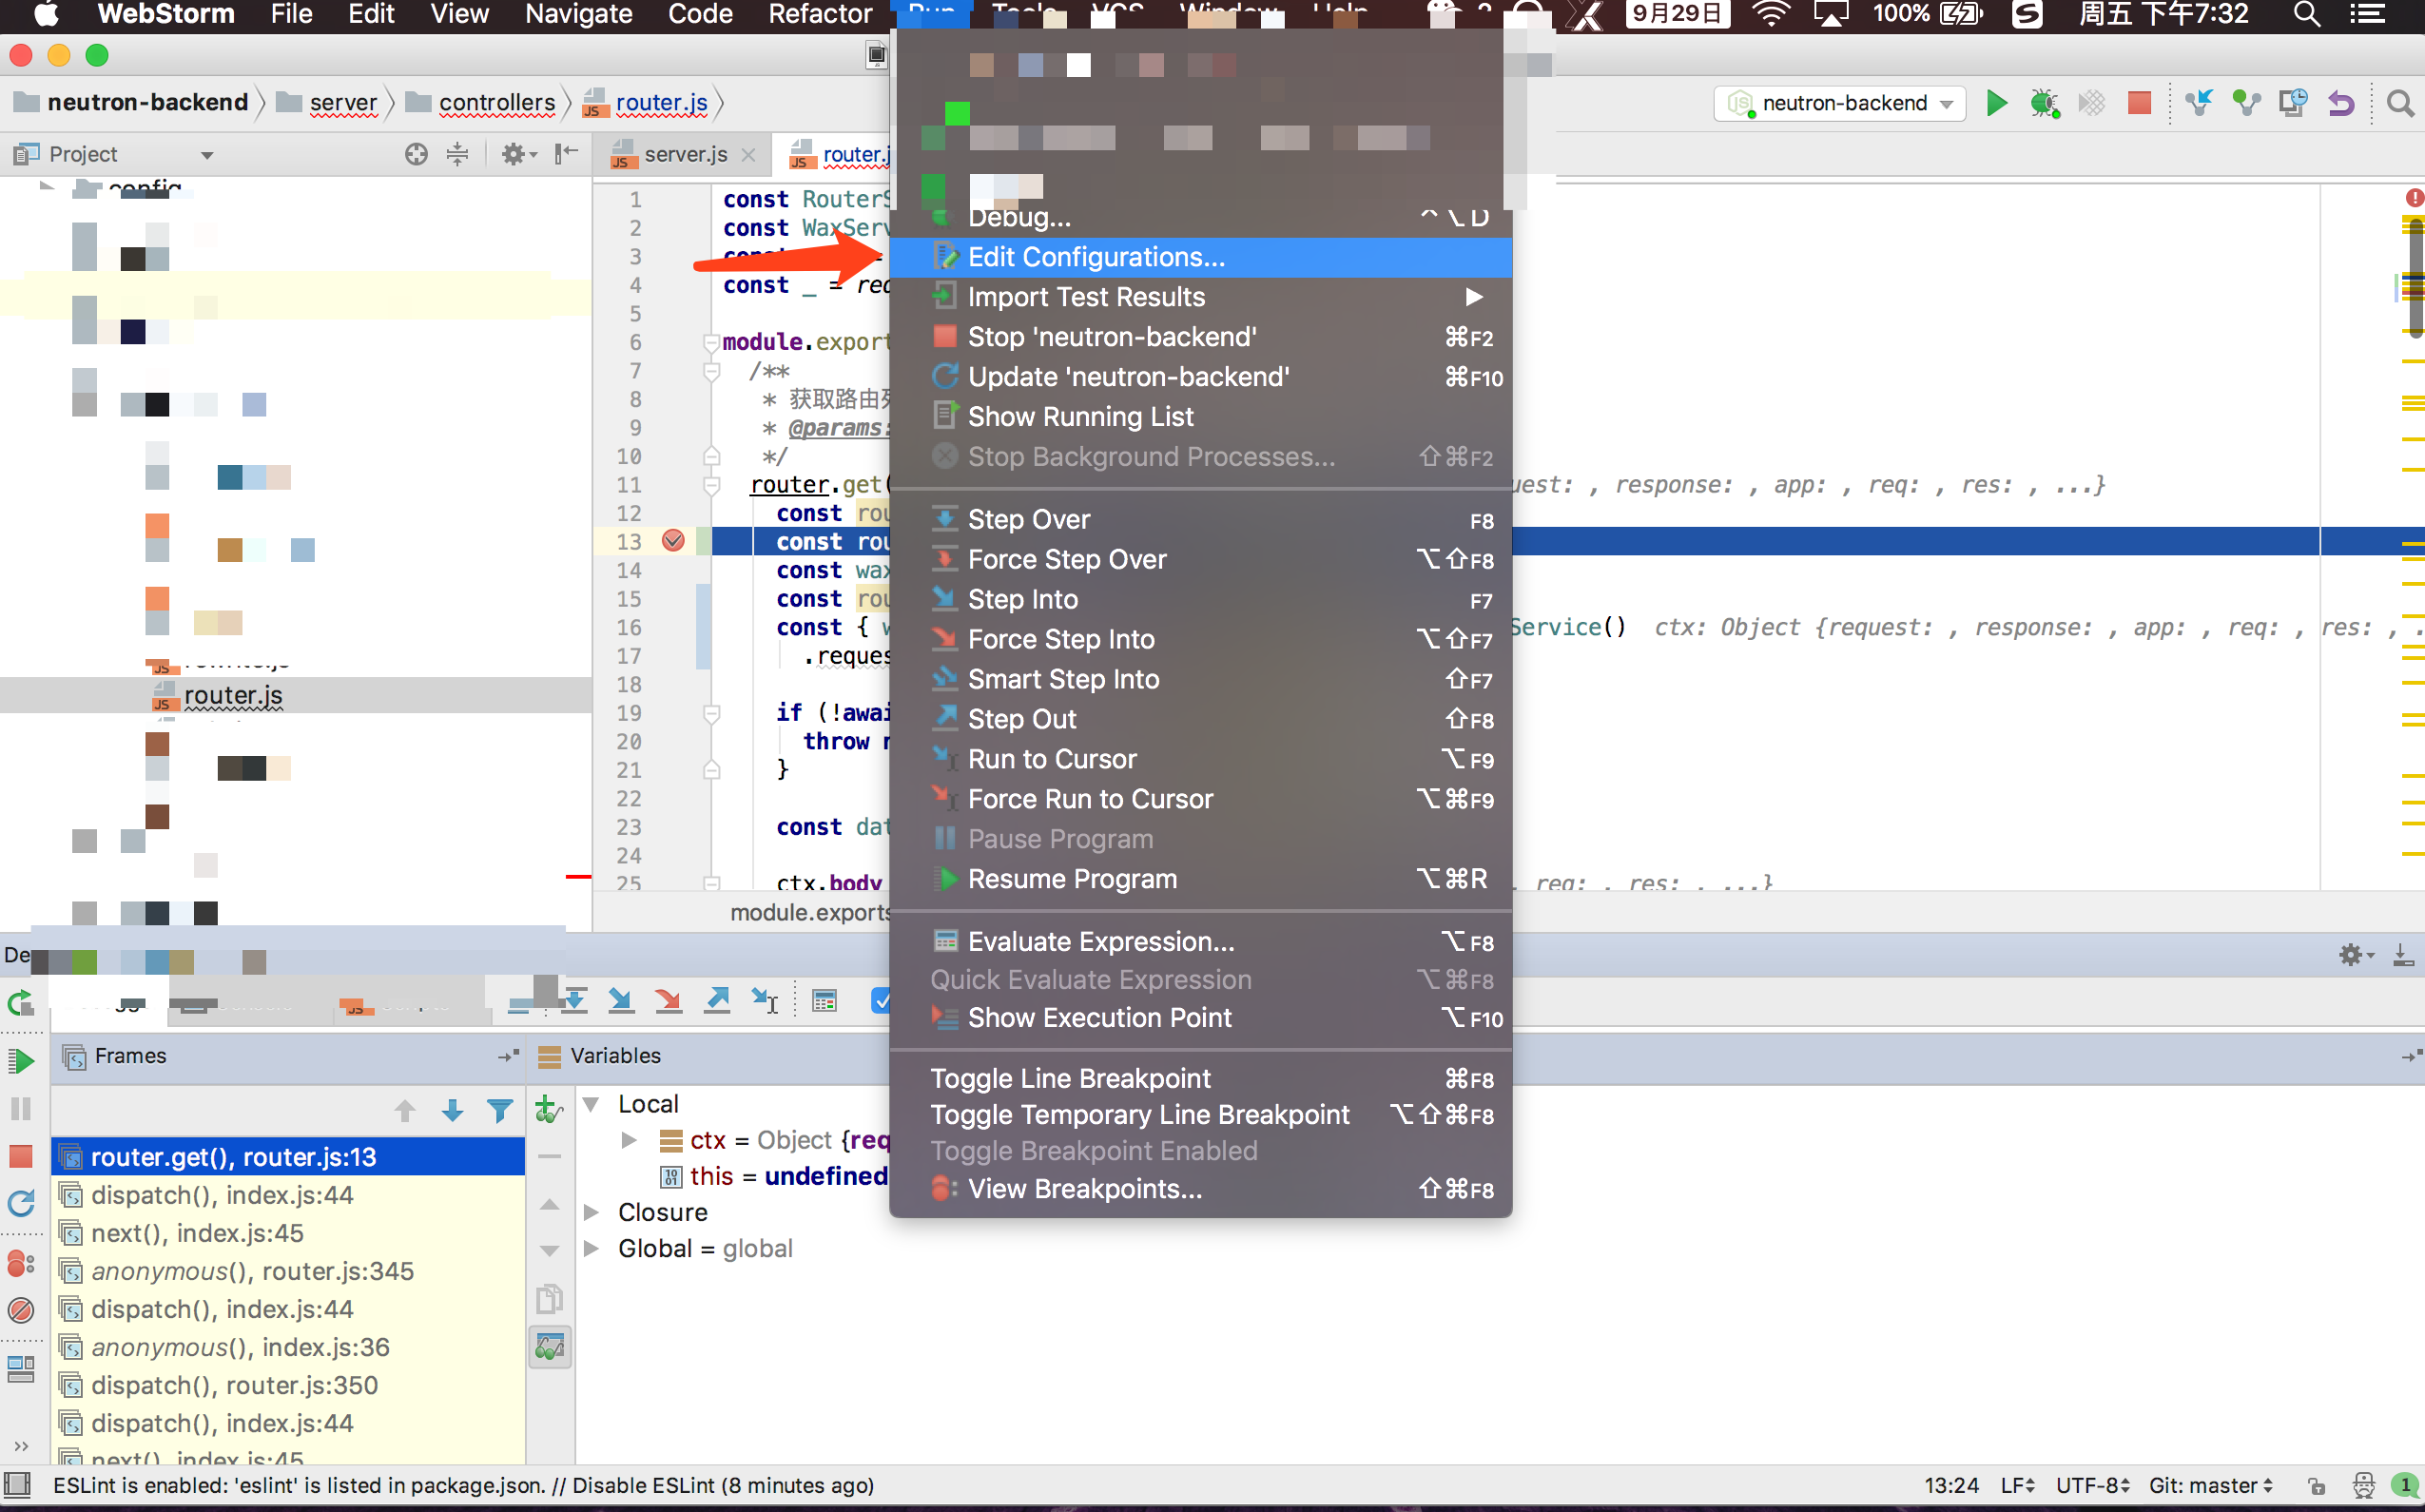
Step 1: Open the project directory, expand the Run menu, and select Edit Configurations
Step 2: Create a new Node.js debug configuration
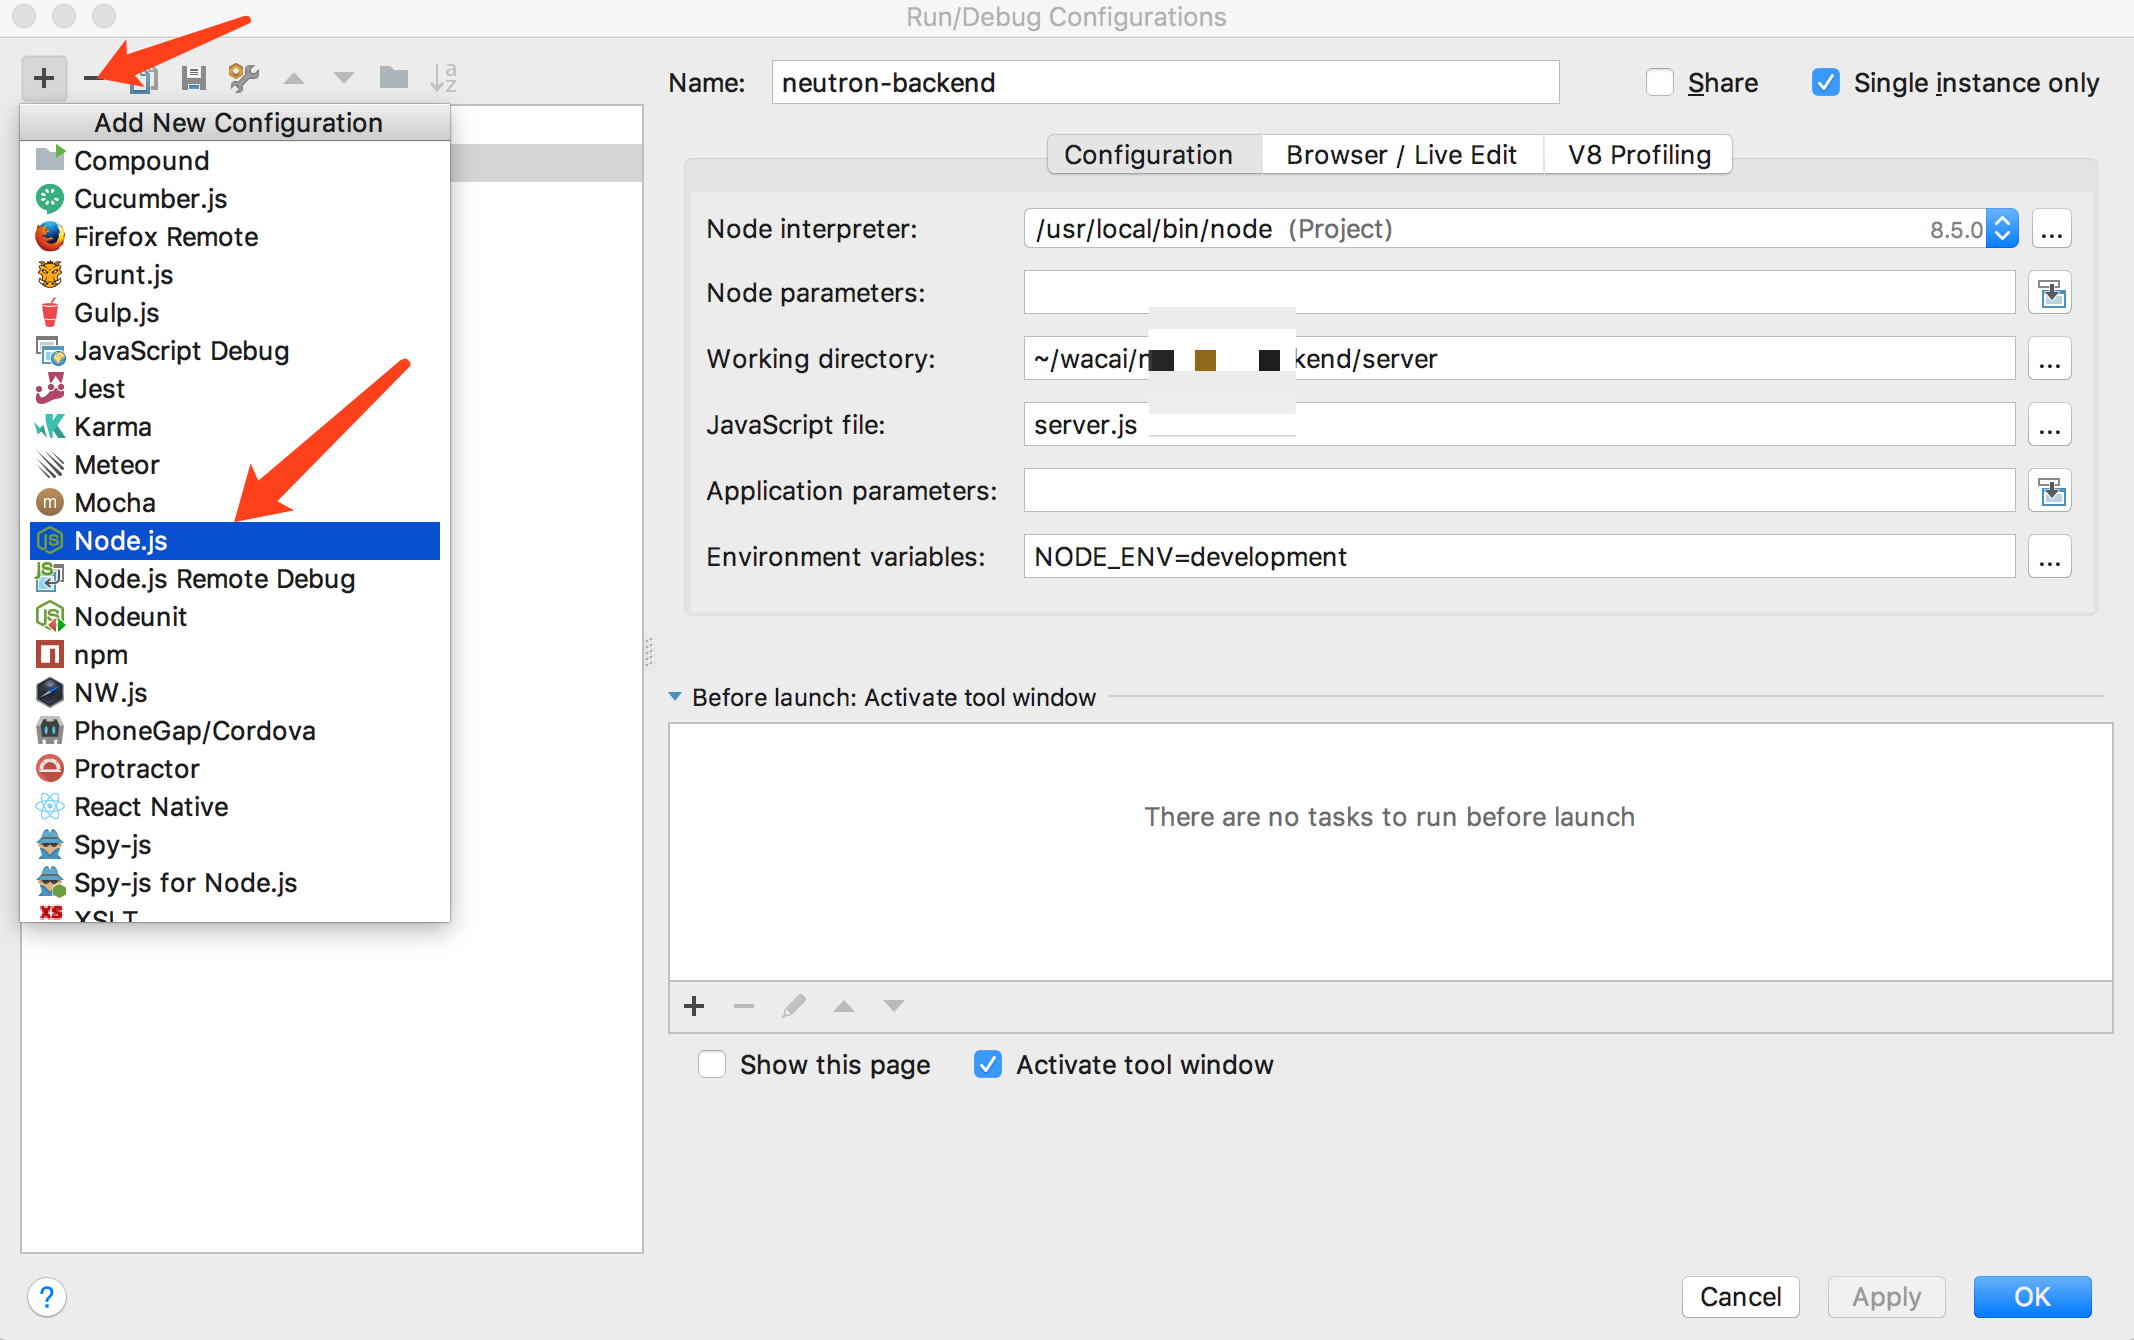
Step 3: Configuration reference
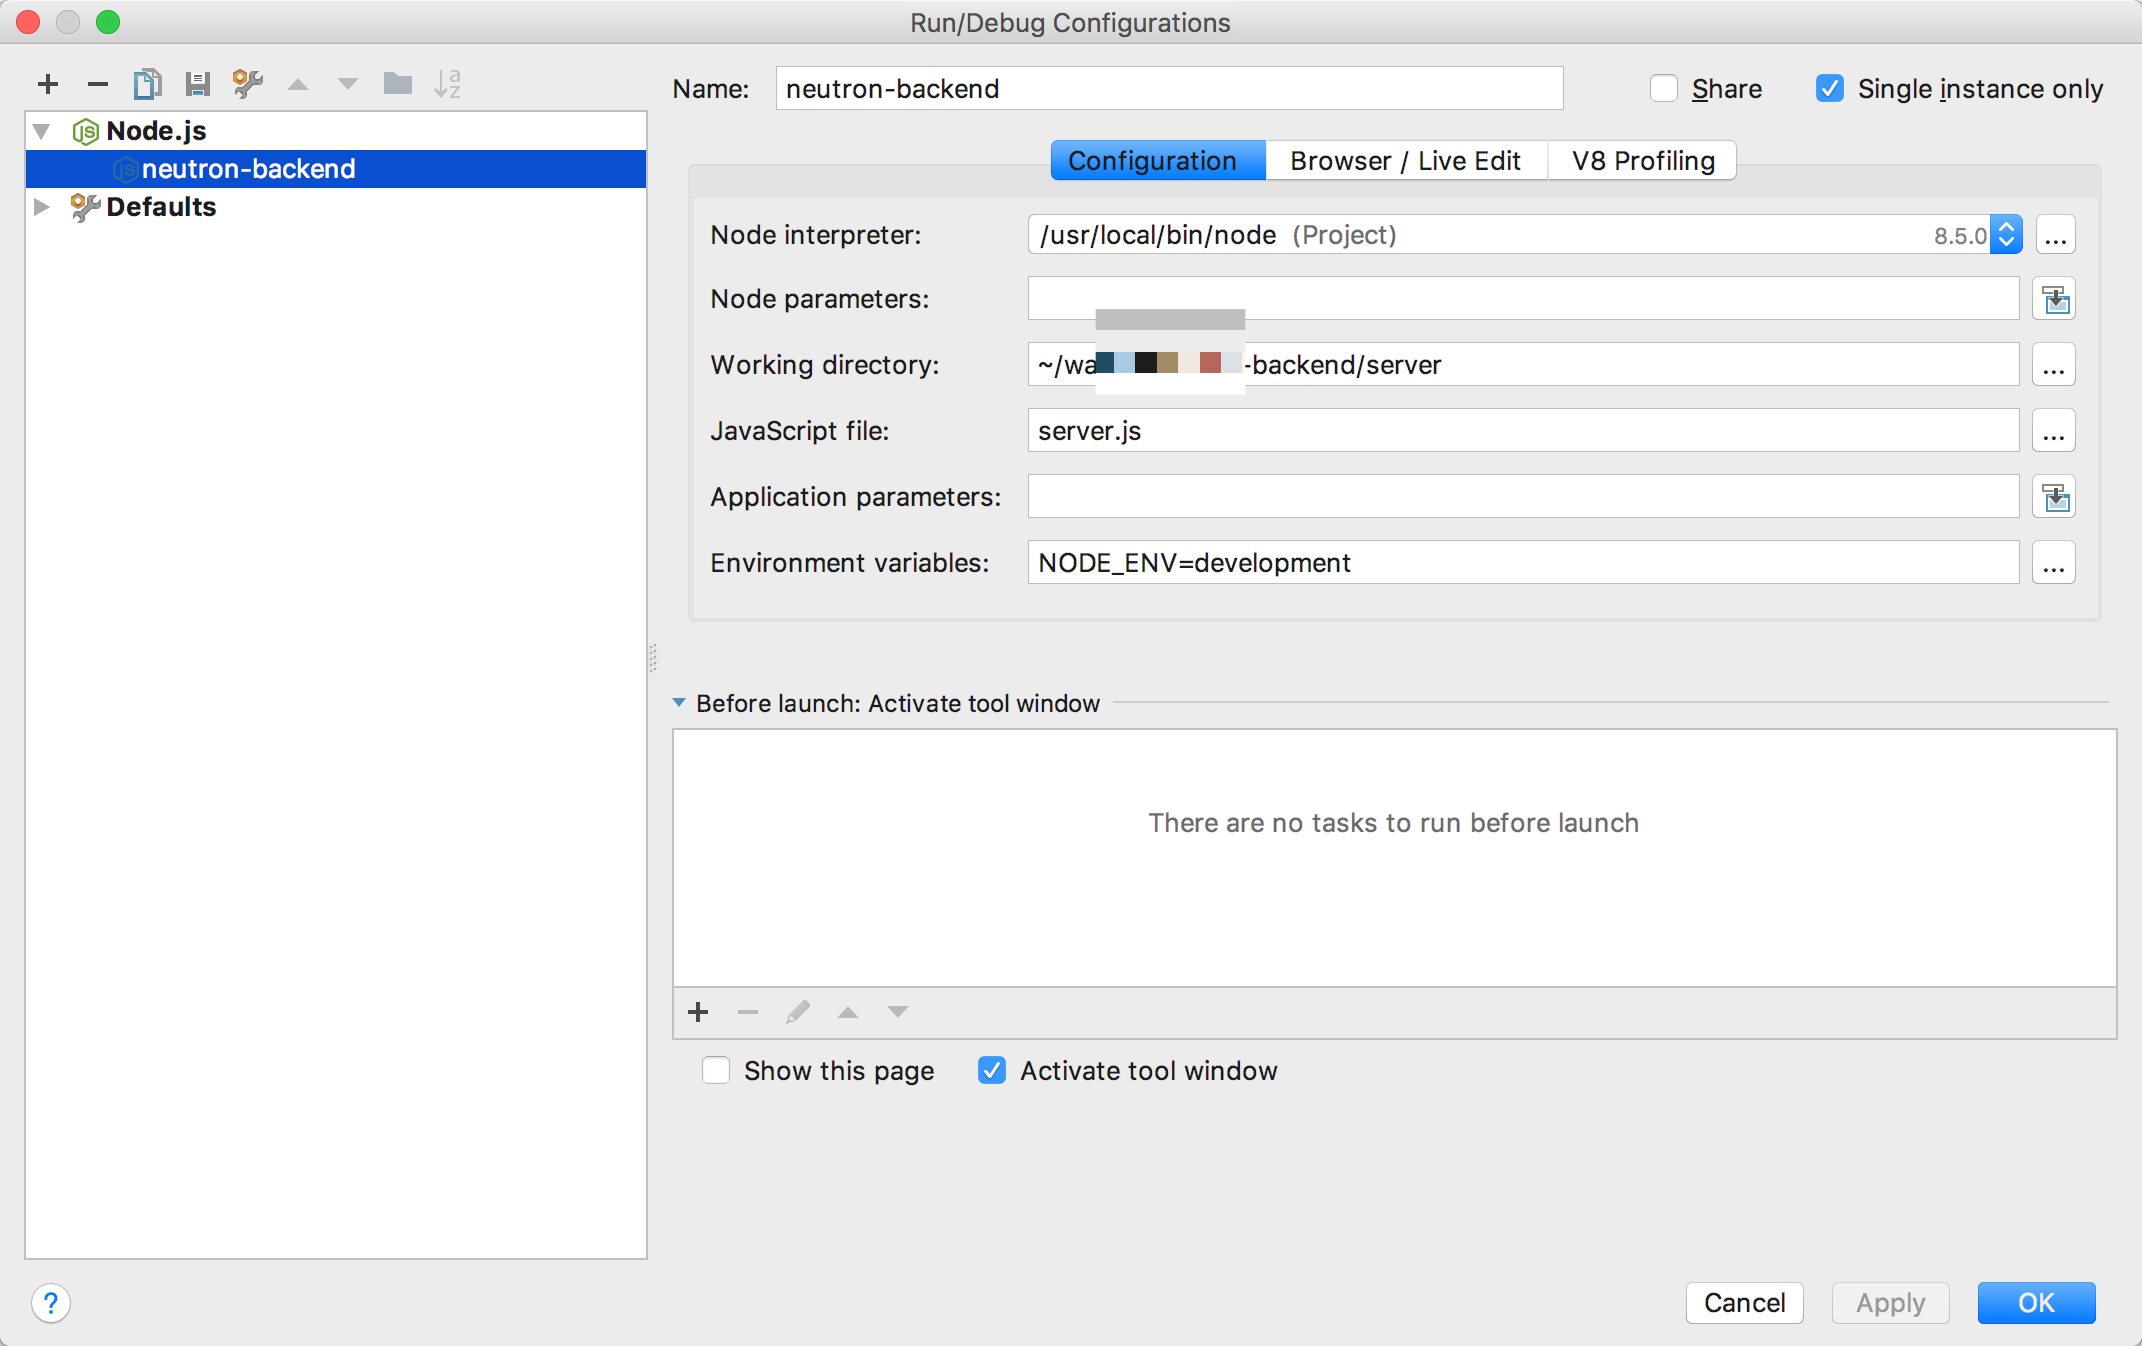
Notes:
- Node interpreter: Path to the Node executable. If using babel-node, you need to add the babel-node path;
- Working directory: The working directory;
- JavaScript file: The project entry file;
- Environment variables: Environment variables;
Step 4: Start the frontend dev server (if applicable)
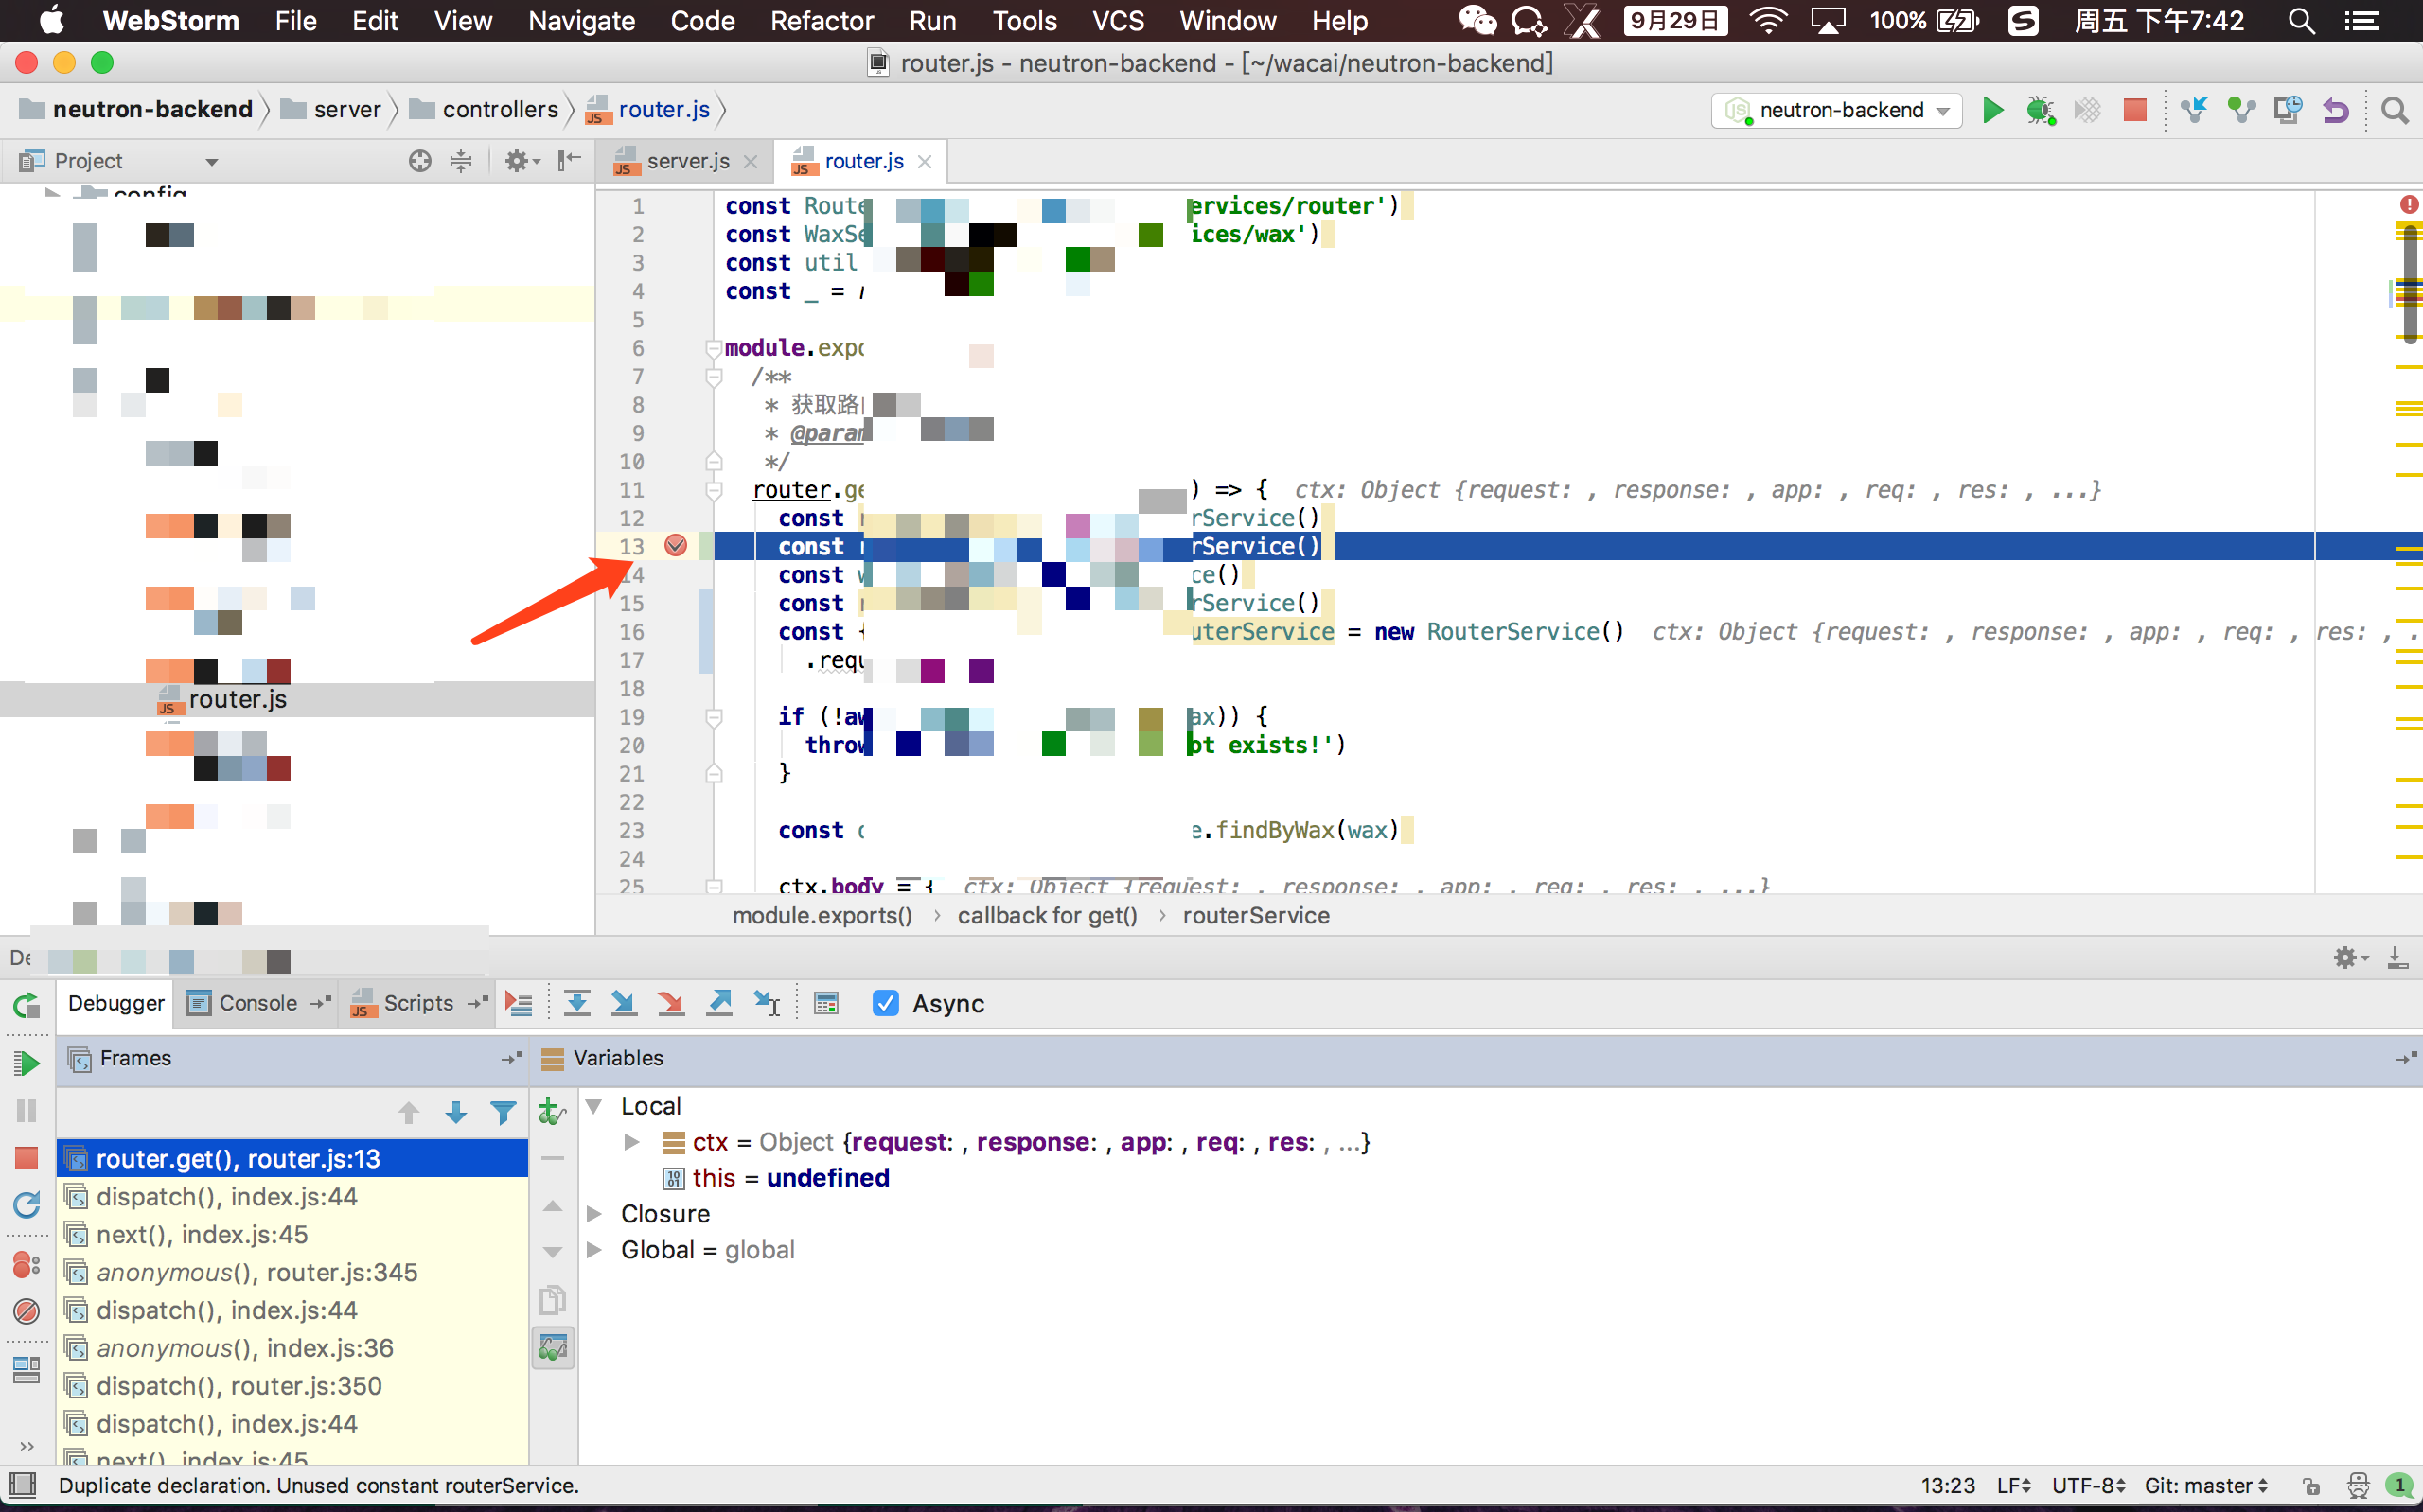
Step 5: Open a source file in WebStorm and click to the left of the line number to add a breakpoint
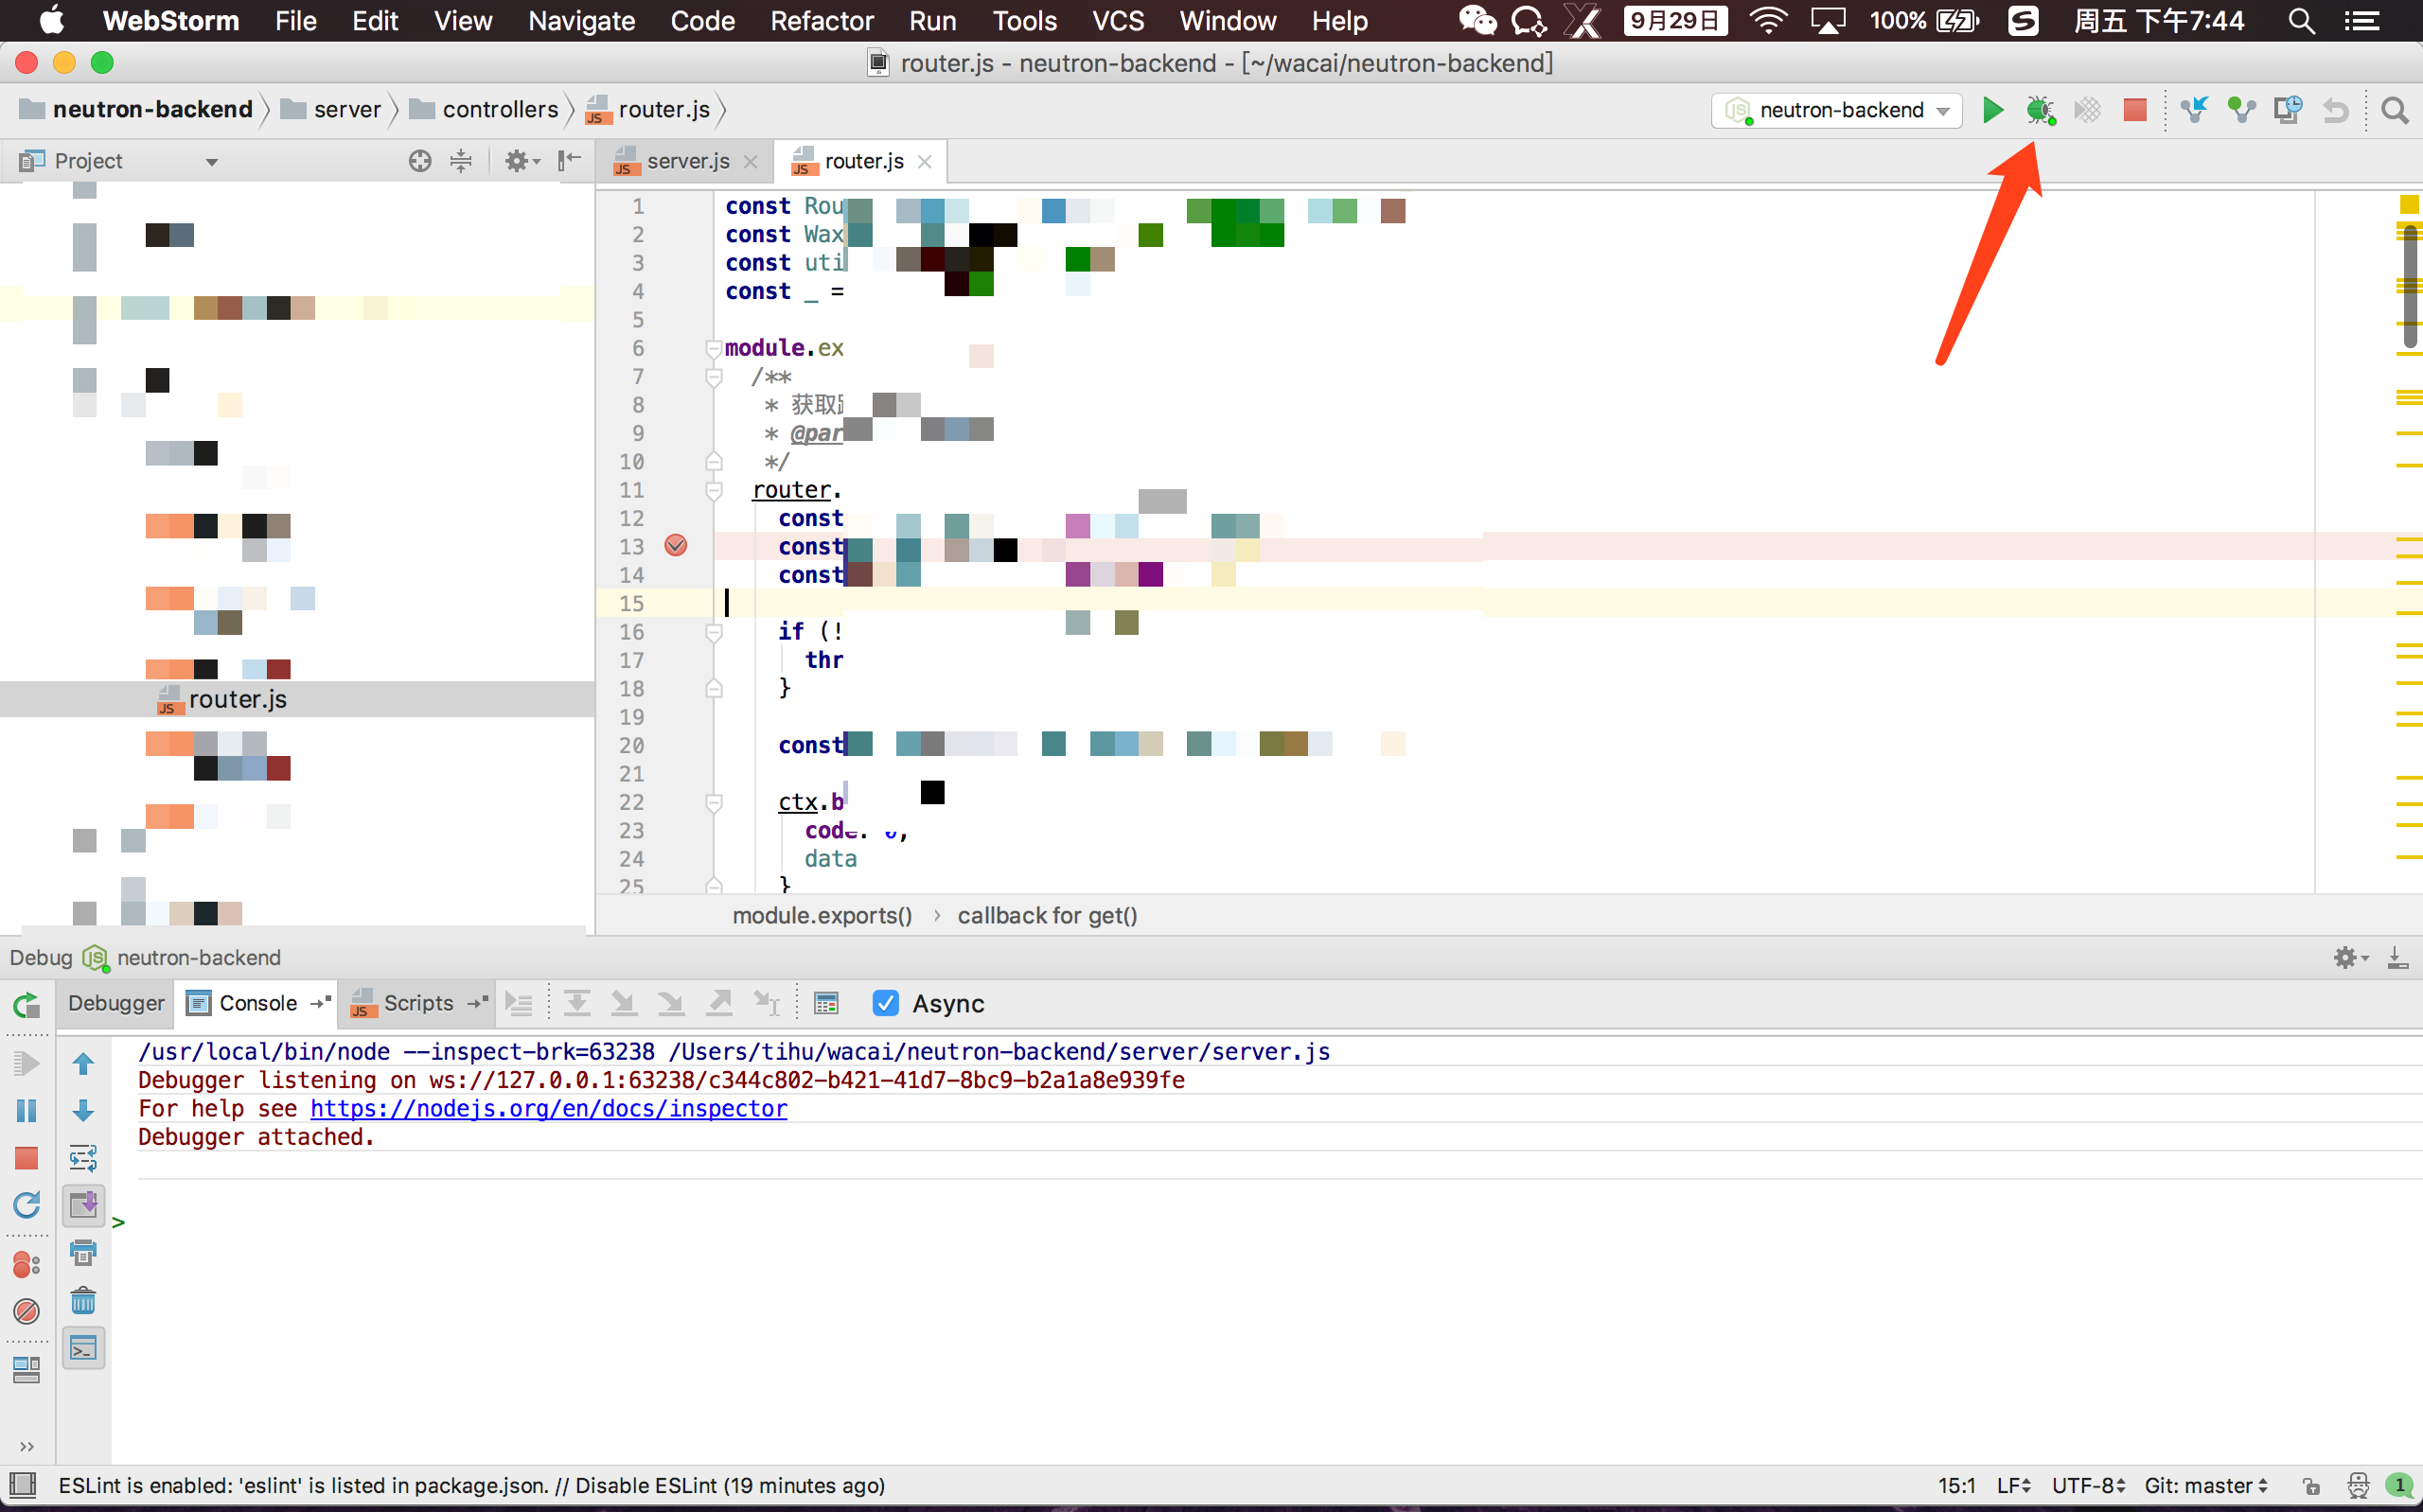
Step 6: Click to start the debug service
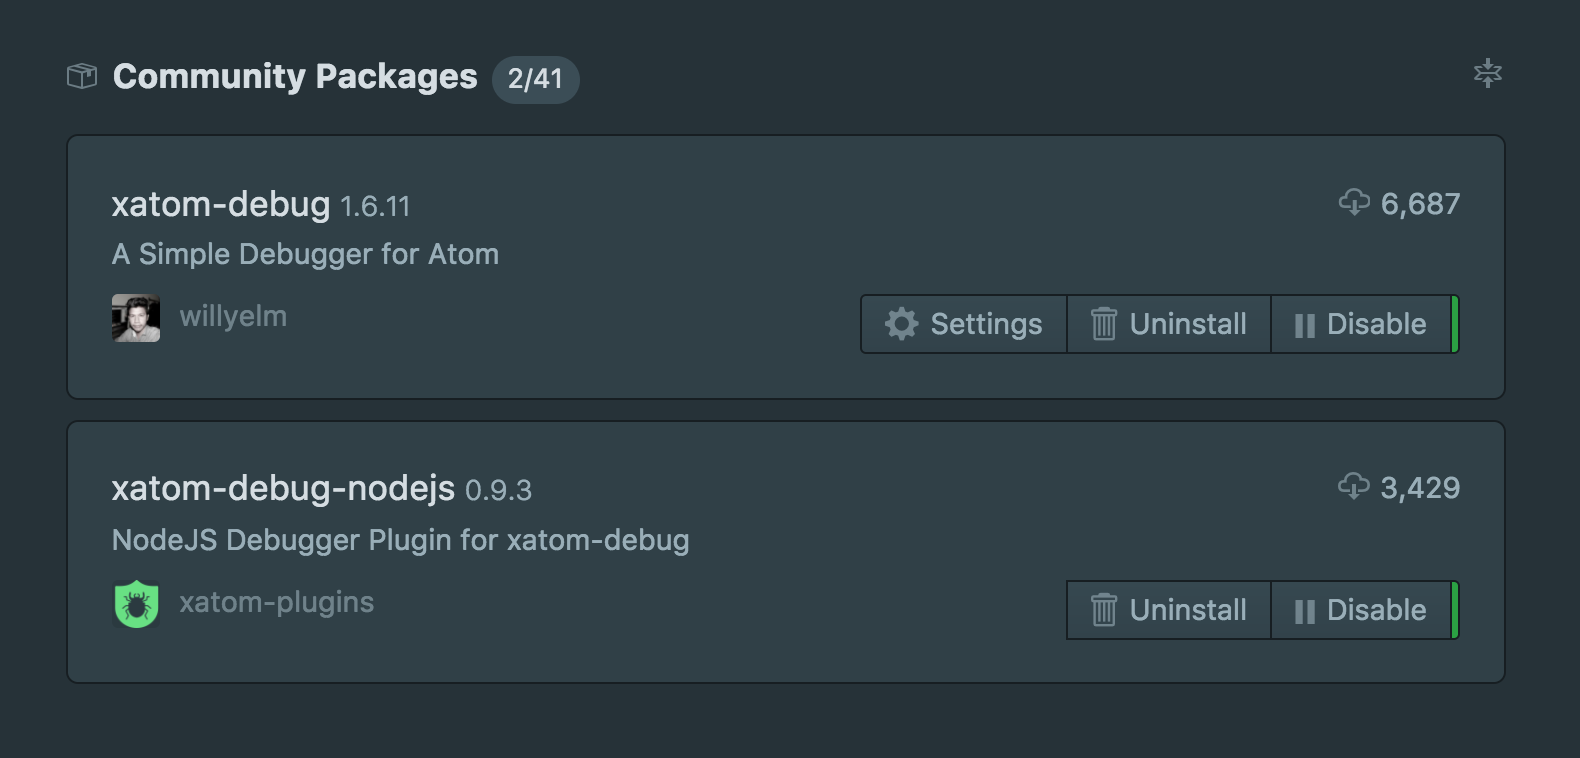
Atom Debugging Configuration
Step 1: Install plugins: a. xatom-debug b. xatom-debug-nodejs
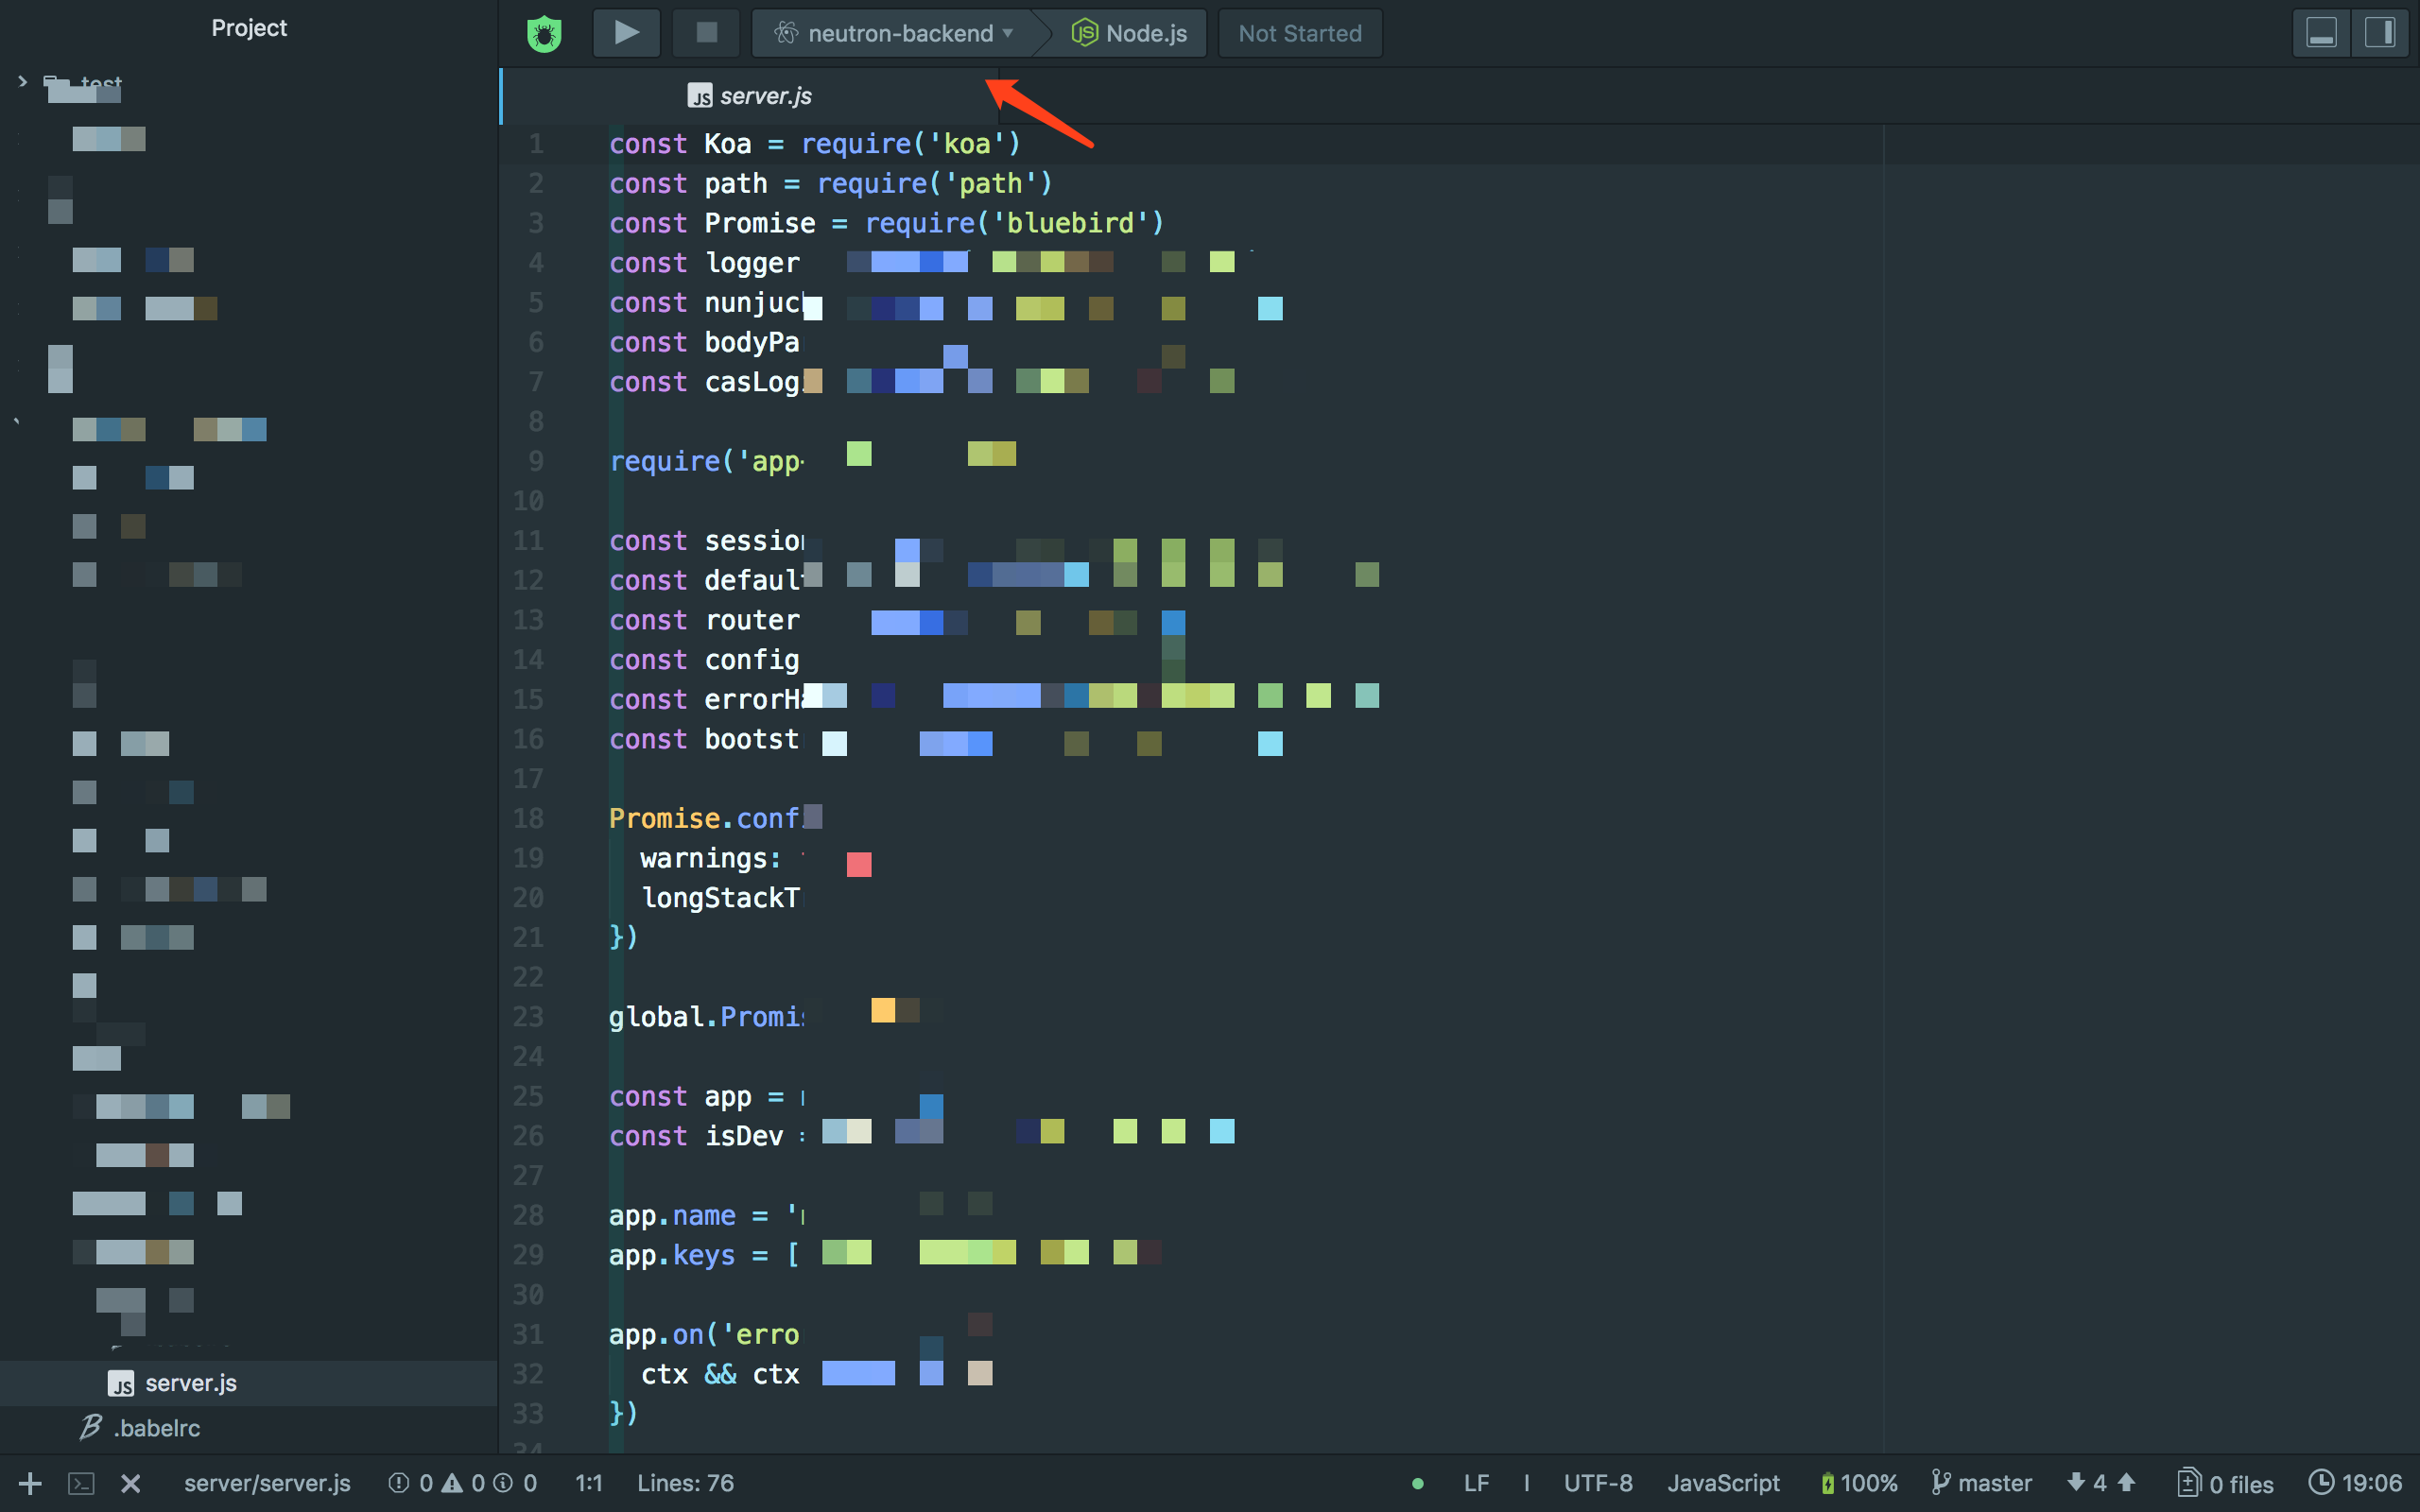
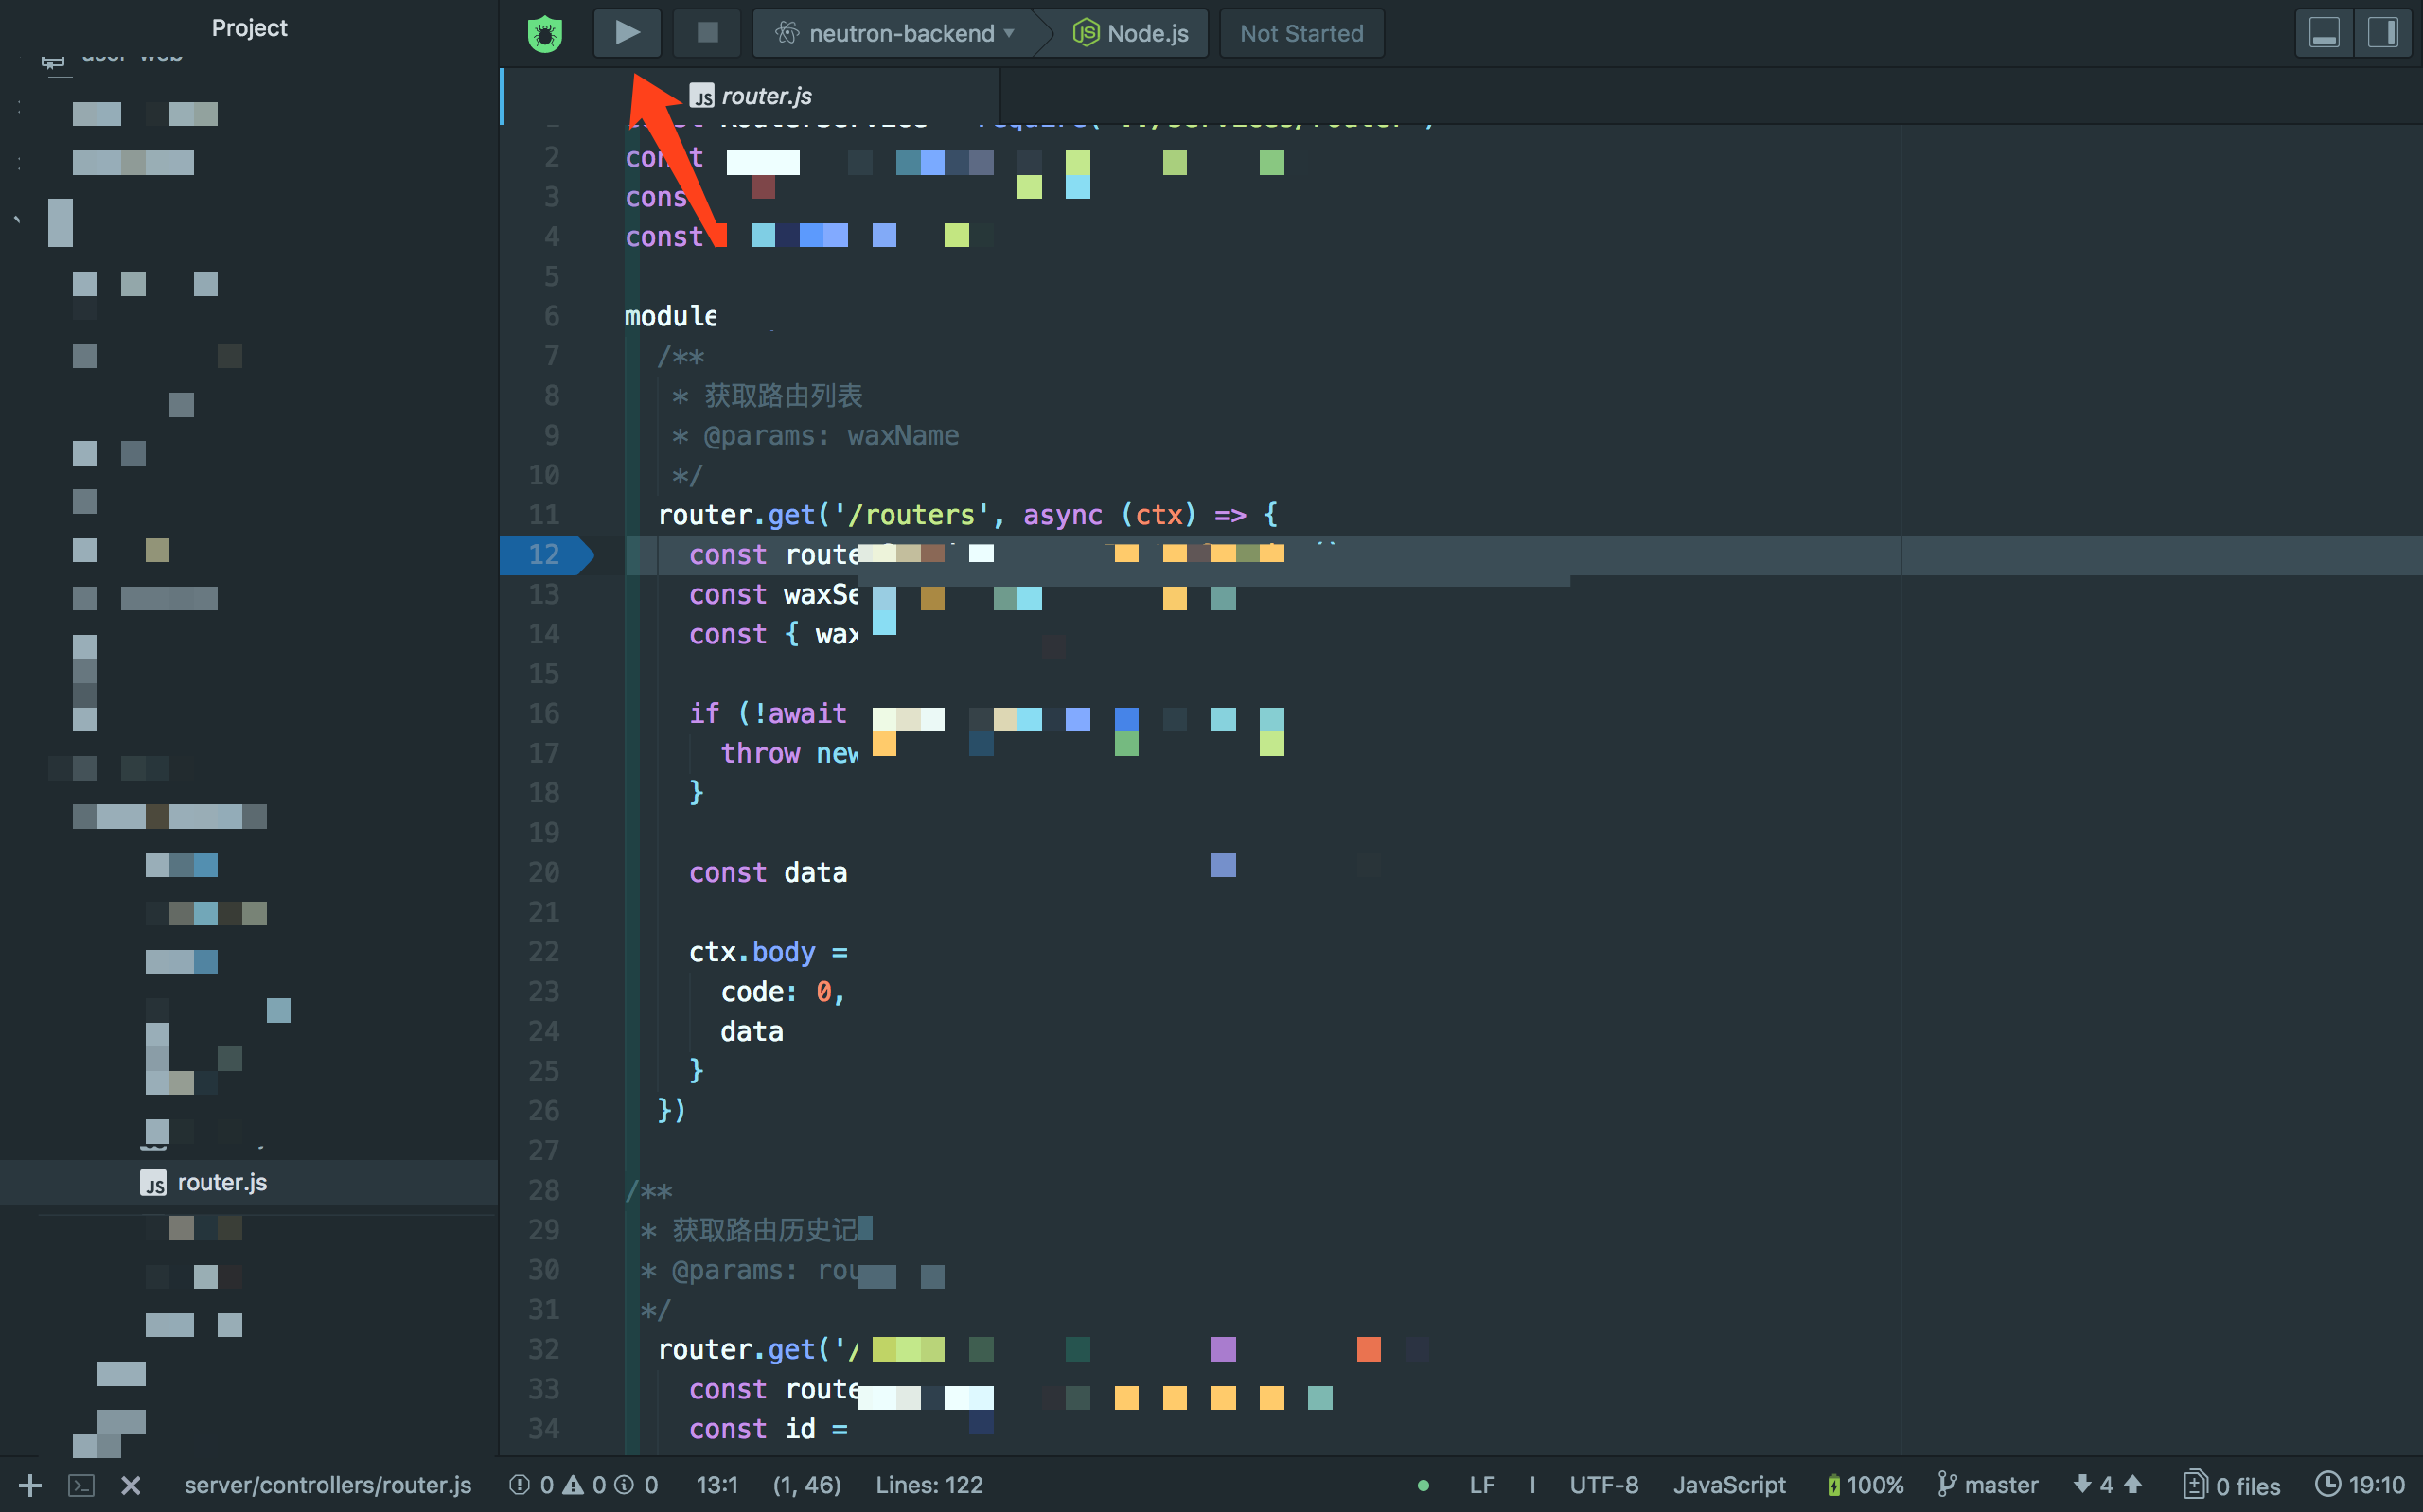
Step 2: Open the Node project entry file. Use the arrow to switch the project directory to debug, then click the Node.js button to the right of the arrow to enter configuration
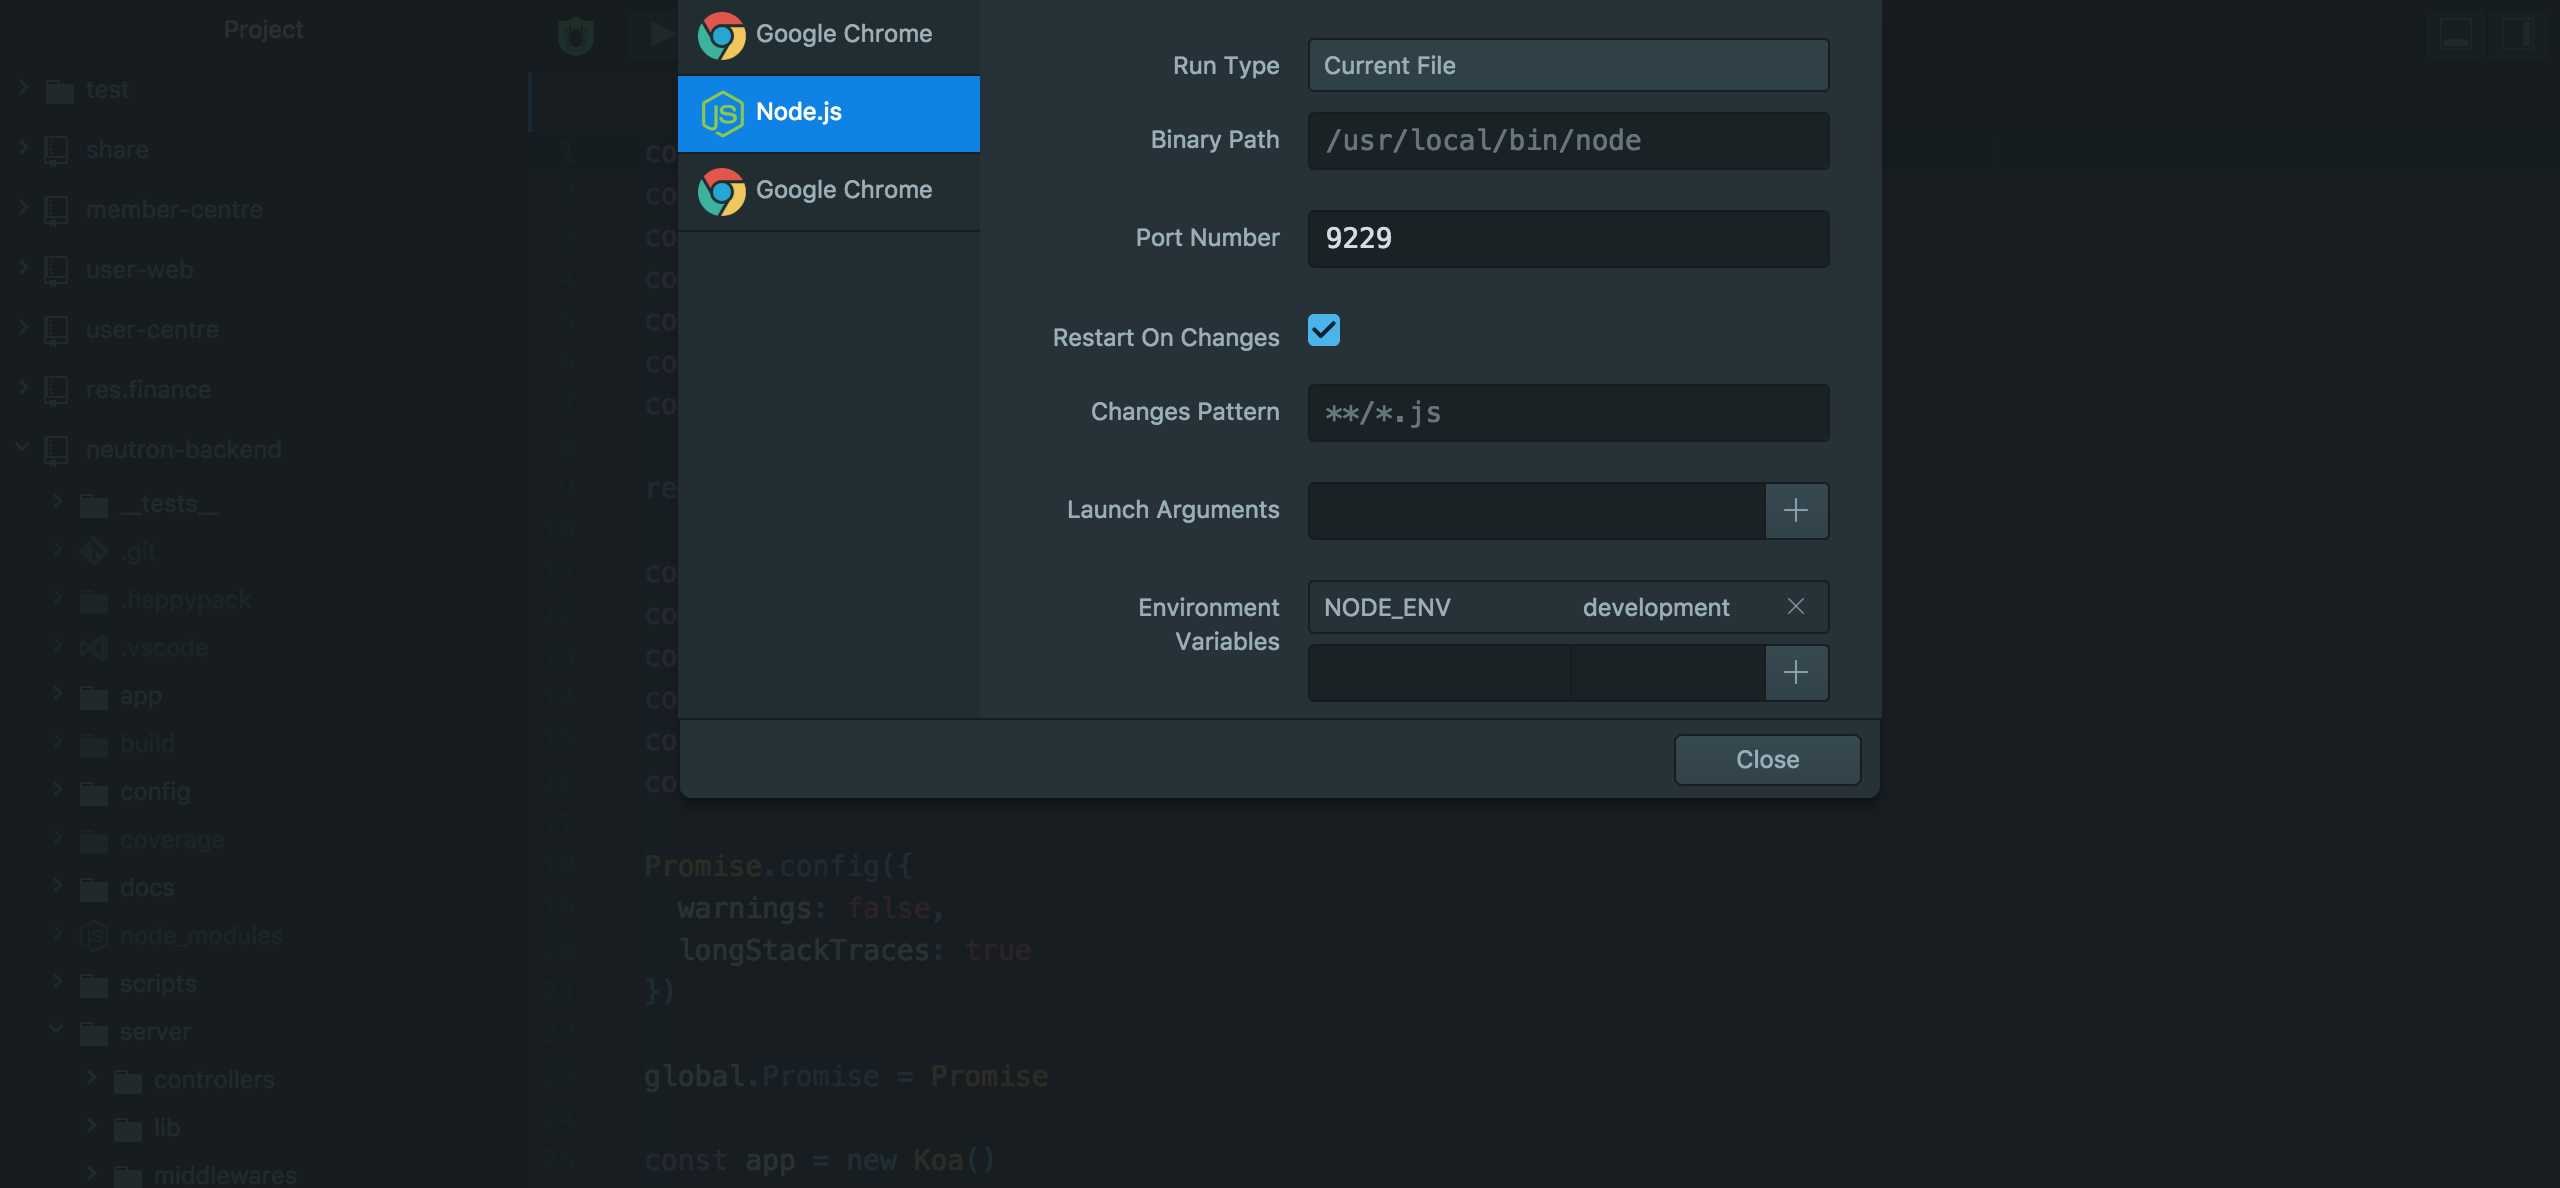
Step 3: Configure debugging
Step 4: Start the frontend dev server (if applicable)
Step 5: Open a source file in Atom and click to the left of the line number to add a breakpoint
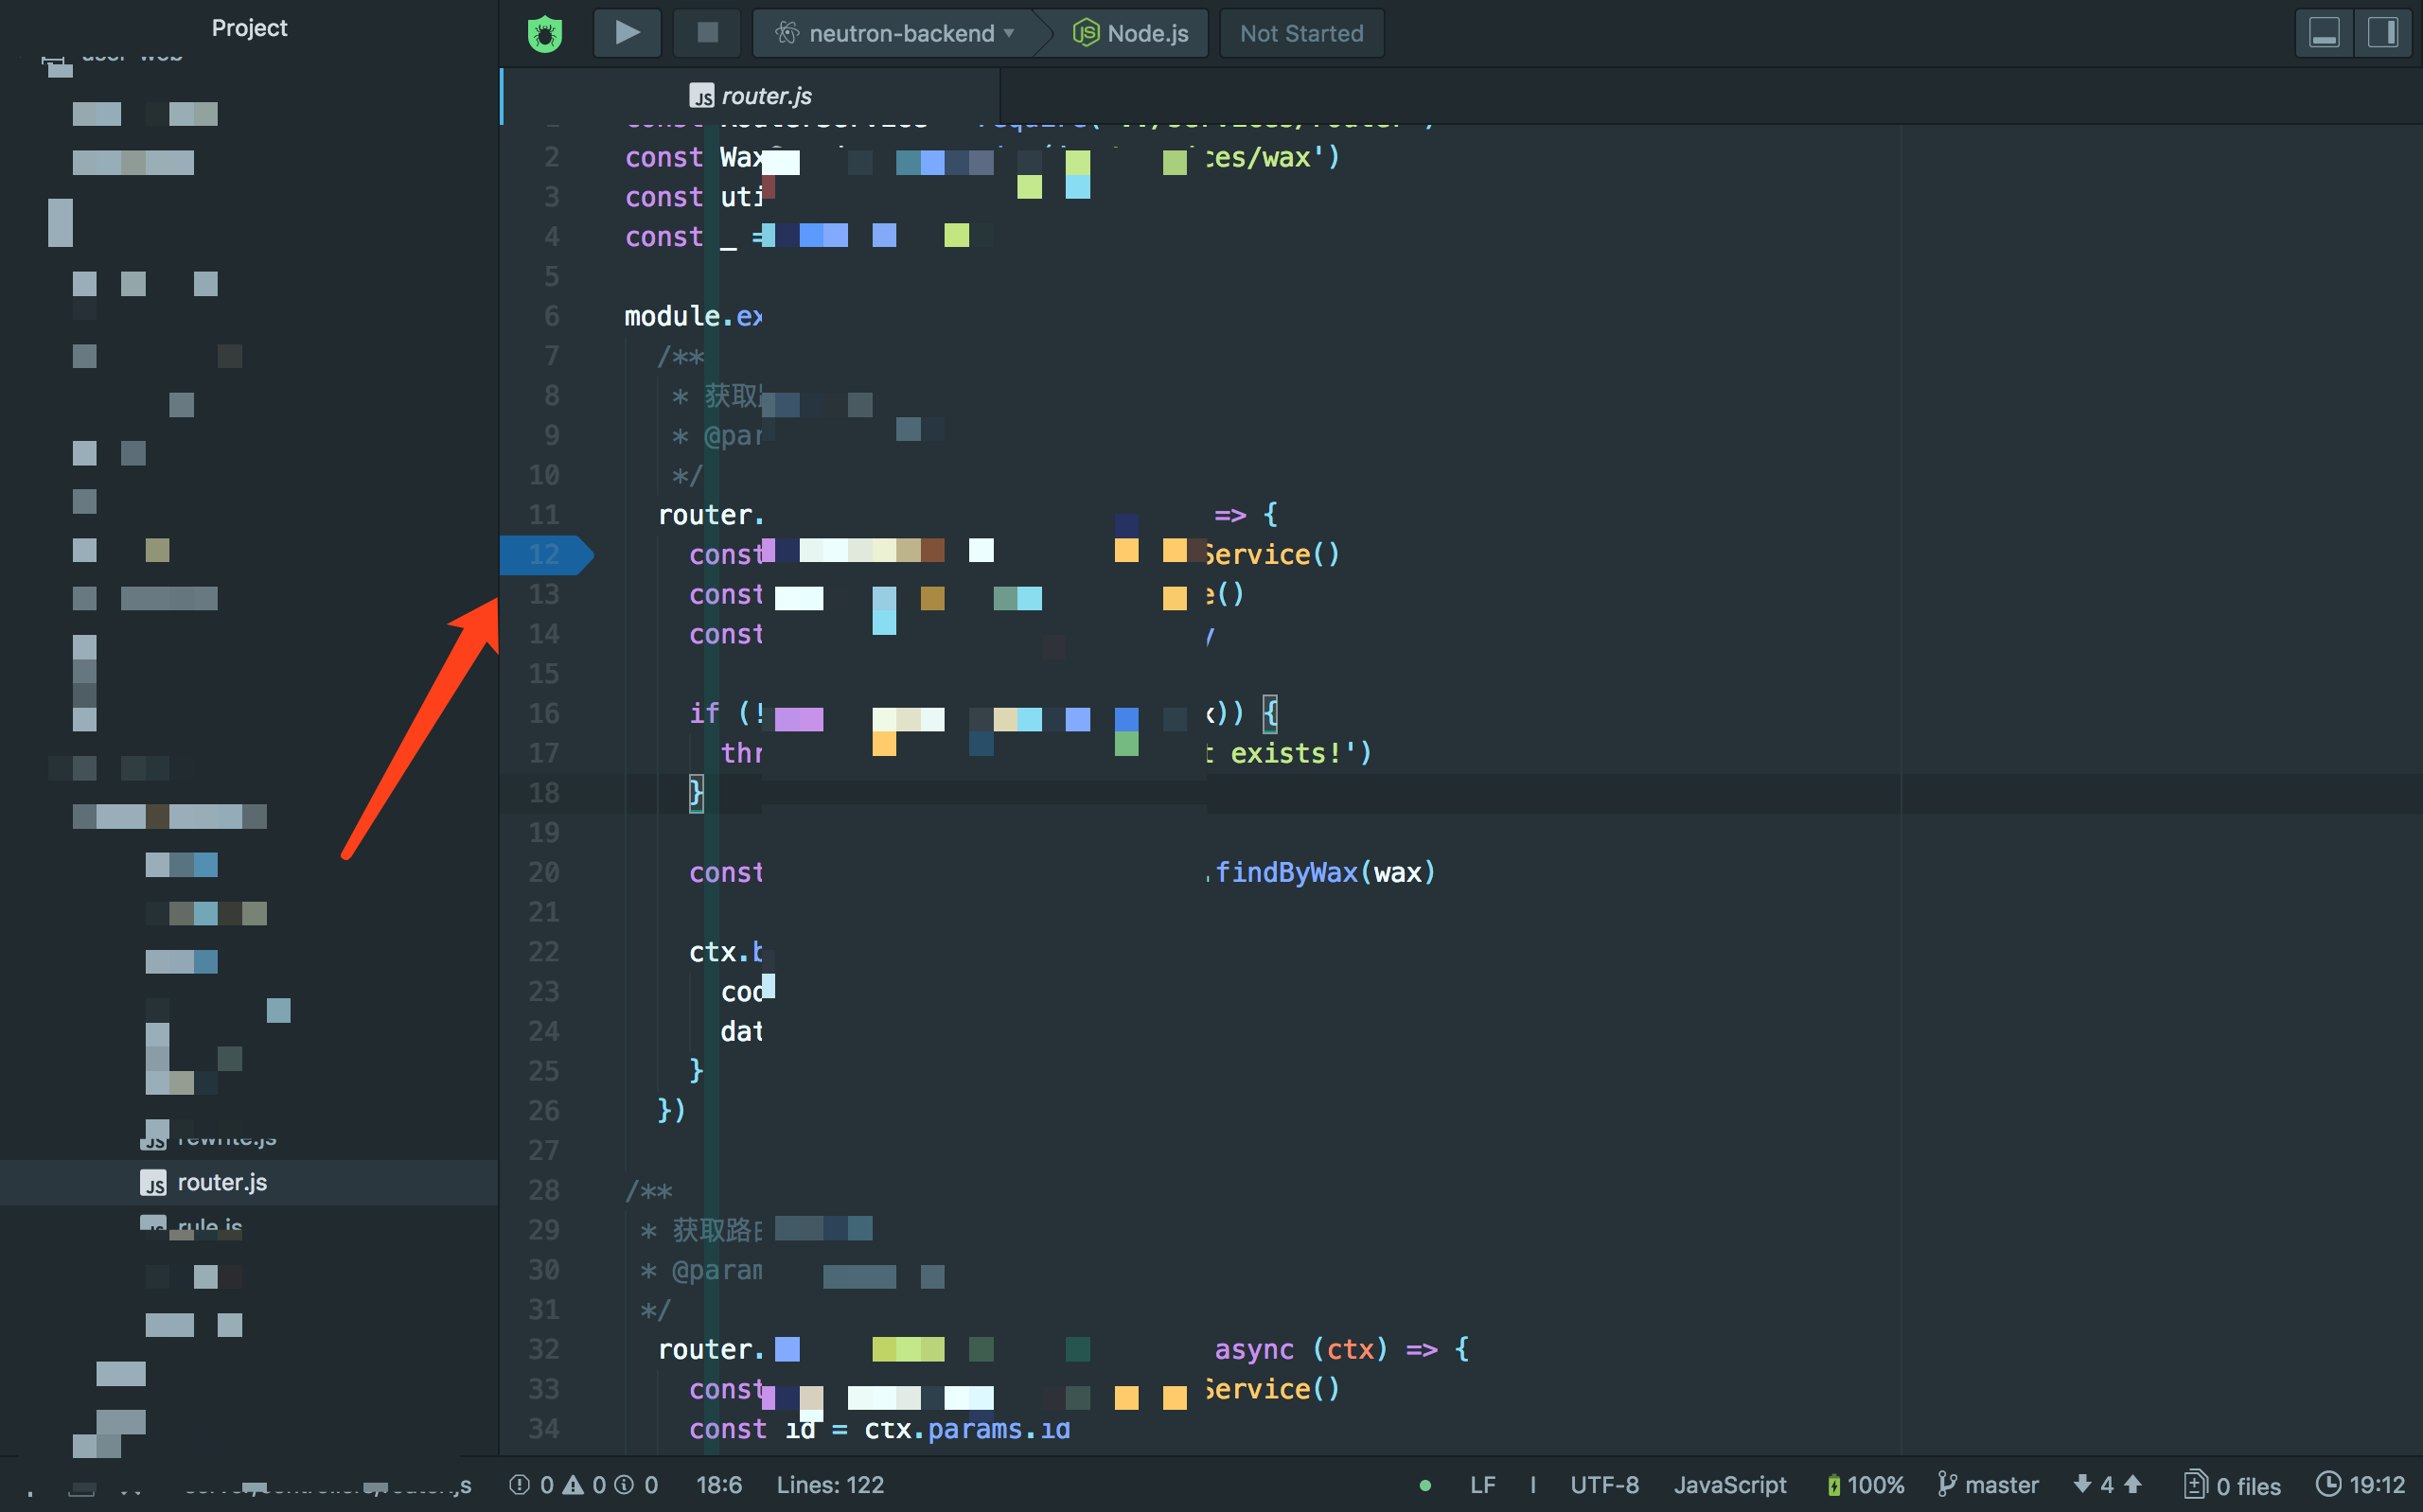
Step 6: Click to start the debug service
A Collection of Node.js Debugging Methods
http://quanru.github.io/2017/08/15/A Collection of Node.js Debugging Methods