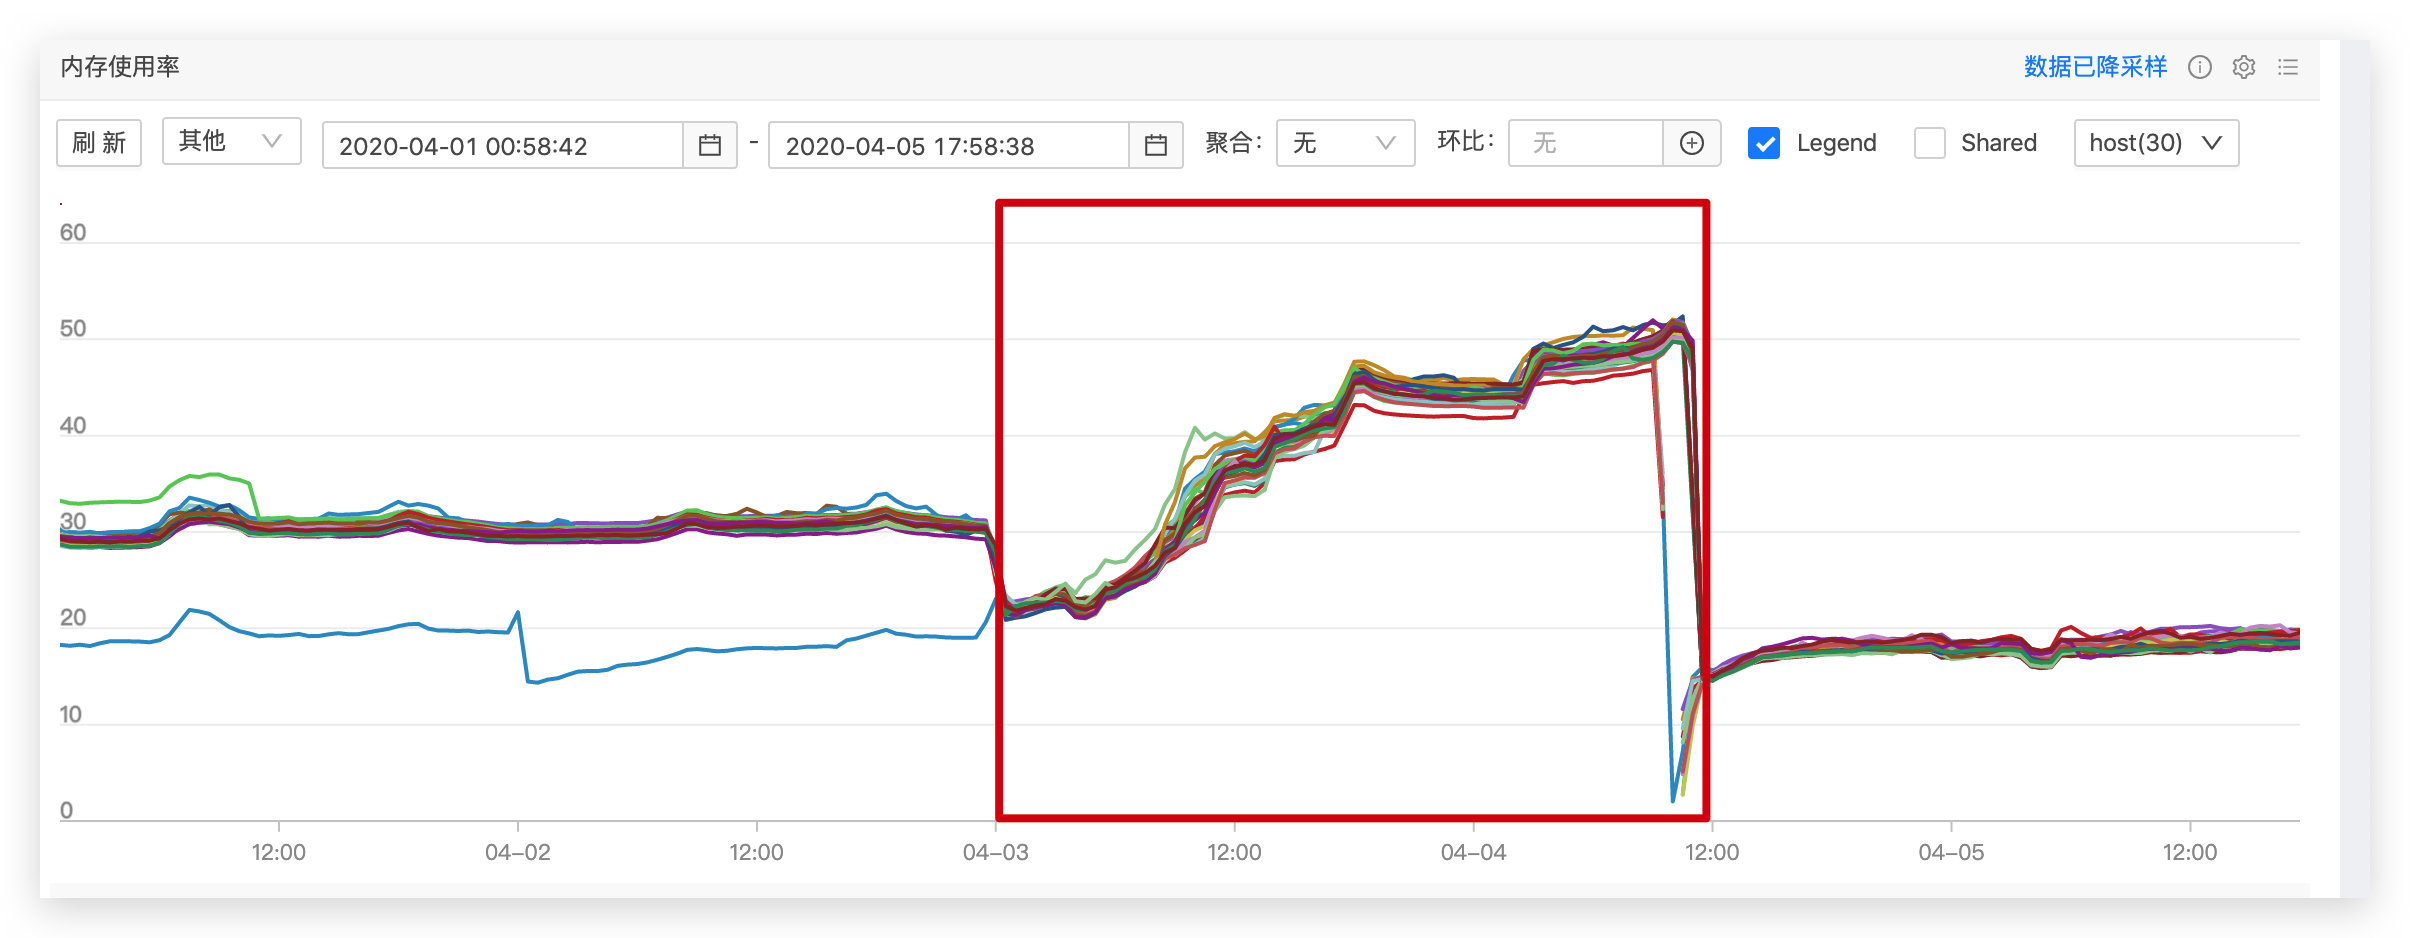
团队最近将两个项目迁移至 degg 2.0 中,两个项目均出现比较严重的内存泄漏问题,此处以本人维护的埋点服务为例进行排查。服务上线后内存增长如下图,其中红框为 degg 2.0 线上运行的时间窗口,在短短 36 小时内,内存已经增长到 50%,而平时内存稳定在 20%-30%,可知十之八九出现了内存泄漏。
背景 团队最近将两个项目迁移至 degg 2.0 中,两个项目均出现比较严重的内存泄漏问题,此处以本人维护的埋点服务为例进行排查。服务上线后内存增长如下图,其中红框为 degg 2.0 线上运行的时间窗口,在短短 36 小时内,内存已经增长到 50%,而平时内存稳定在 20%-30%,可知十之八九出现了内存泄漏。
排查思路 由于两个接入 degg 2.0 的服务均出现内存泄漏问题,因此初步将排查范围锁定在 degg 2.0 引入或重写的基础组件上,重点怀疑对象为 nodex-logger 组件;同时为了排查内存泄漏,我们需要获取服务运行进程的堆快照(heapsnapshot ),获取方式可参看文章:Node 案发现场揭秘 —— 快速定位线上内存泄漏 。
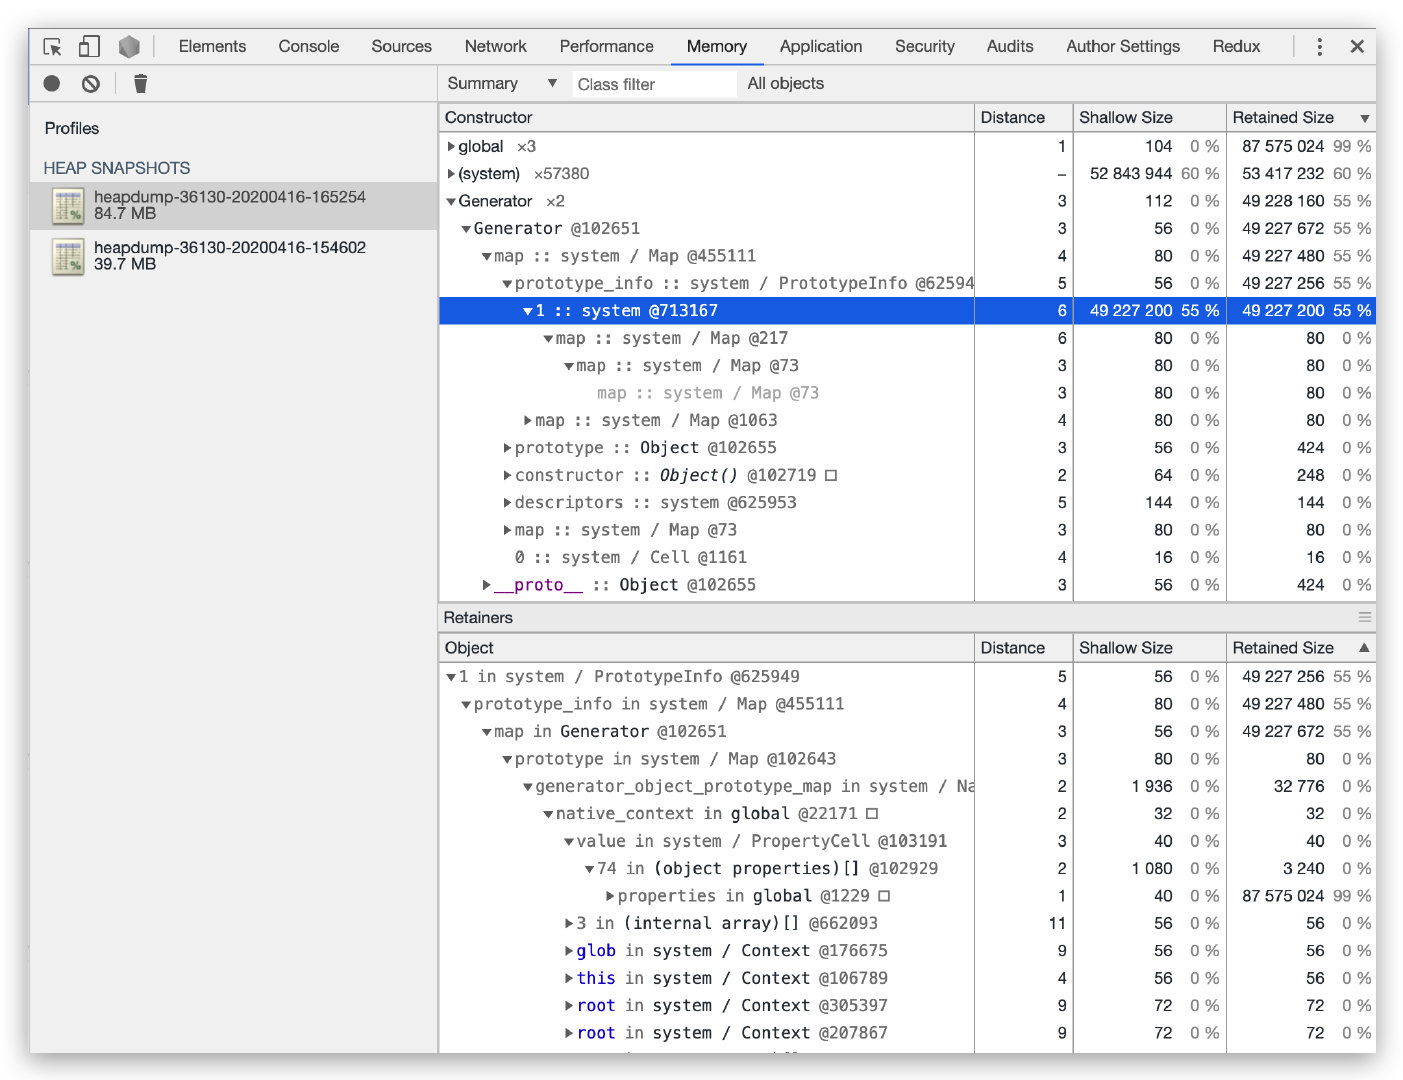
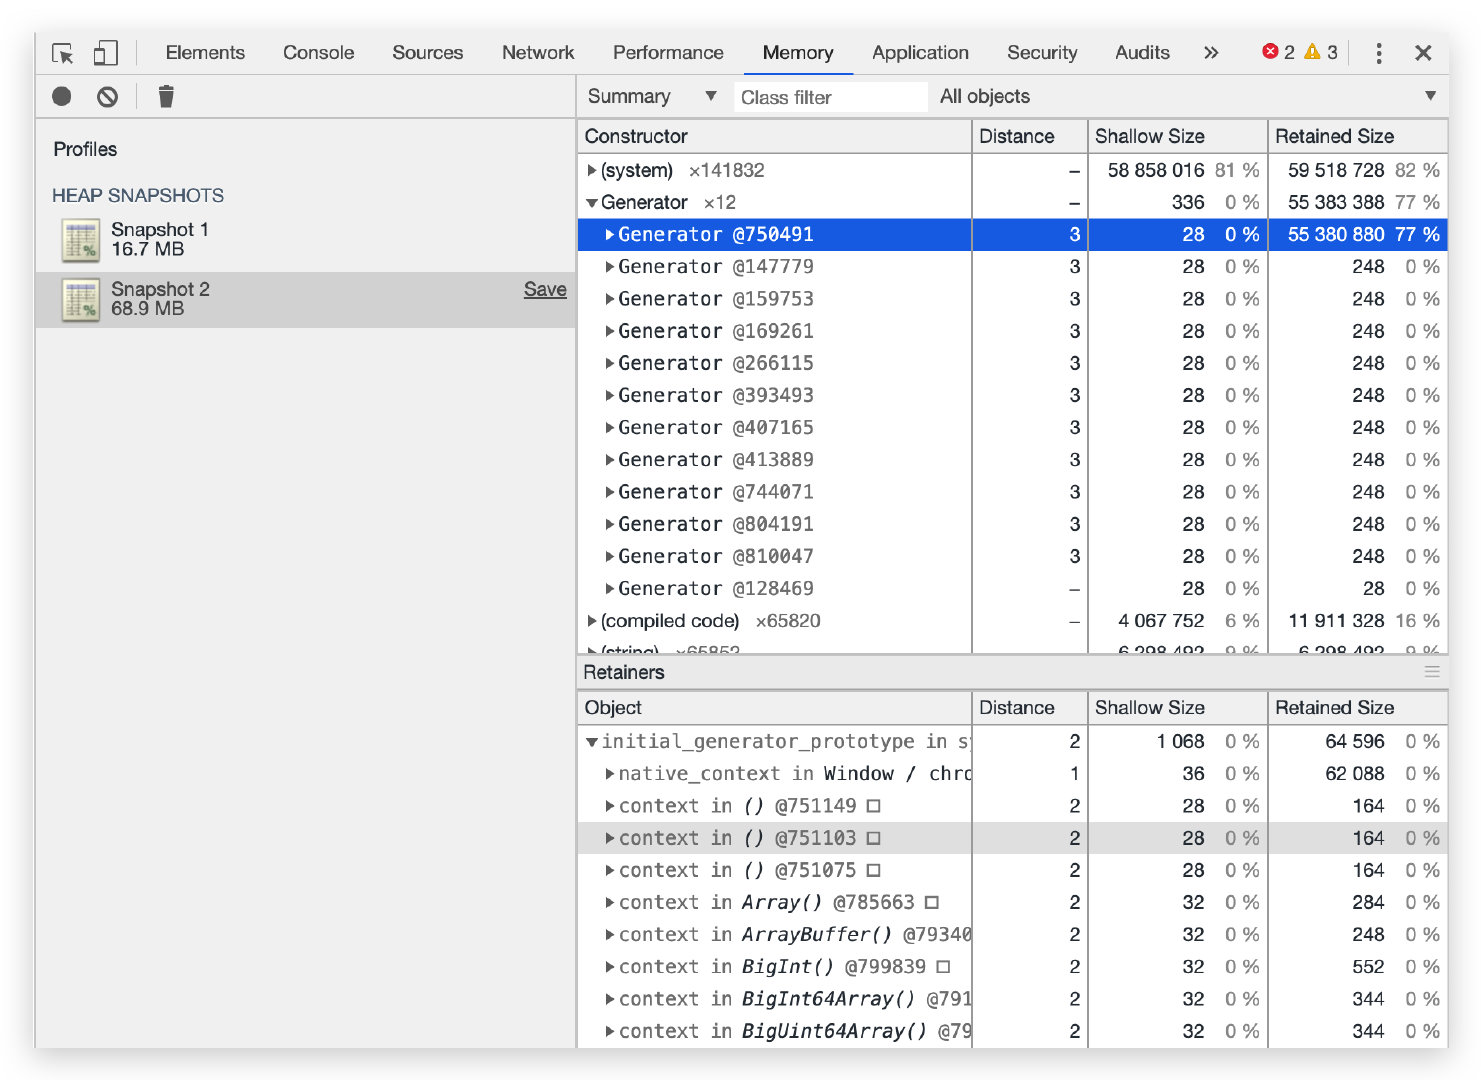
排查过程 一、获取堆快照 使用 alinode 获取堆快照,服务启动后,使用小流量预热一两分钟便记录第1份堆快照(2020-4-16-16:52),接着设置 qps 为 125 对服务进行施压,经过大约一个小时(2020-4-16-15:46)获取第2份堆快照。使用 Chrome dev 工具载入两份堆快照,如下图所示,发现服务仅短短运行一小时,其堆快照文件就增大了 45MB,而初始大小也不过 39.7MB;我们按 Retained Size 列进行排序,很快就发现了一个『嫌疑犯』,即 generator;该项占用了 55% 的大小,同时 Shallow Size 却为 0%,一项一项地展开,锁定到了图中高亮的这行,但是继续展开却提示 0%,线索突然断了。
盯着 generator 进入思考,我的服务代码并没有 generator 语法,为什么会出现 generator 对象的内存泄漏呢?此时我把注意力转到 node_modules 目录中,由于最近一直在优化 nodex-kafka 组件,有时直接在 node_modules 目录中修改该组件的代码进行调试,因此几乎每个文件头部都有的一段代码引起了我的注意:
1
2
3
4
5
6
7
8
9
10
"use strict" ;var __awaiter = (this && this .__awaiter ) || function (thisArg, _arguments, P, generator ) { function adopt (value ) { return value instanceof P ? value : new P (function (resolve ) { resolve (value); }); } return new (P || (P = Promise ))(function (resolve, reject ) { function fulfilled (value ) { try { step (generator.next (value)); } catch (e) { reject (e); } } function rejected (value ) { try { step (generator["throw" ](value)); } catch (e) { reject (e); } } function step (result ) { result.done ? resolve (result.value ) : adopt (result.value ).then (fulfilled, rejected); } step ((generator = generator.apply (thisArg, _arguments || [])).next ()); }); };
这个代码是 typescript 源码编译后的产出,由于代码使用了 async/await 语法,因此都编译成 __awaiter 的形式,在源码中使用 async 函数的地方,在编译后都使用 __awaiter 进行包裹:
1 2 3 4 5 6 7 8 9 10 11 12 13 (async function ( await Promise .resolve (1 ); await Promise .resolve (2 ); })() (function ( return __awaiter (this , void 0 , void 0 , function * () { yield Promise .resolve (1 ); yield Promise .resolve (2 ); }); })();
同时一个关于 generator 内存泄漏的 #30753 generator functions - memory leak 也引起了我的注意,该 issue 遇到的问题无论从 Node.js 的版本和内存泄漏的表现都和我遇到的问题十分相似。所以我在工程的 node_modules 中搜索所有 __awaiter 字符串,发现了 3 个模块编译出了上述代码,分别是:
nodex-loggernodex-kafkanodex-apollo
由于模块的 tsconfig.json 的 target 字段将目标产出为 es6,因此才会使用 generator 去模拟 async/await 语法,但是从 Node.js v8.10.0 开始已经 100% 支持了 ES2017 的所有特性,所以本不该编译 async/await 语法,此处遂将这 3 个模块的目标产出配置改为 es2017,这样 tsc 就不会编译 async/await 语法。
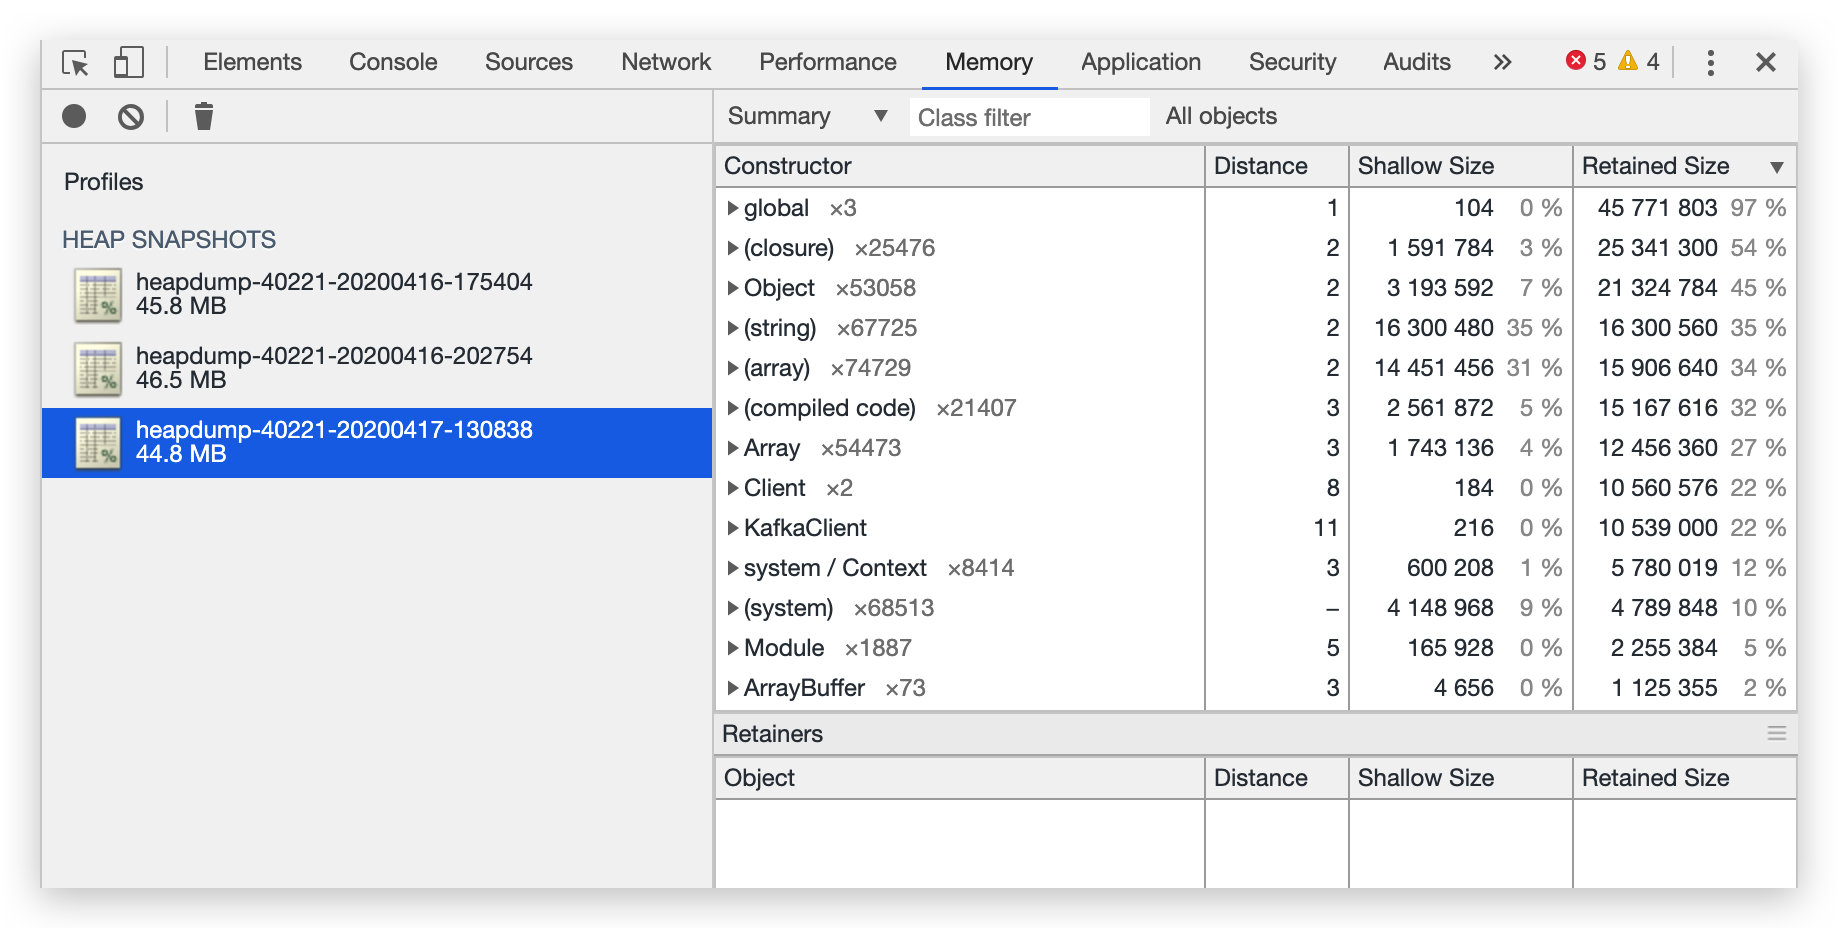
二、验证 重复之前获取堆快照的步骤,惊奇地发现即使过了一天,内存也没有增长,而且 generator 也没有持有未释放的内存:
至此,内存泄漏问题已经解决!那么如何避免遇到这个问题呢?
如何避免 一、解决步骤 步骤一 该问题仅在特定的 Node.js 版本中存在,请使用版本区间 [v11.0.0 - v12.16.0) 之外的 Node.js,从而防止二方 npm 组件、三方 npm 组件的 generator 语法使你的服务出问题
步骤二 将自己的 typescript 的目标环境(target)编译为 es2017 及以上,同时应尽量使用 async/await 语法而不是 generator 语法,从而防止别人使用 [v11.0.0 - v12.16.0) 版本时,引入你的 npm 组件而导致内存泄漏
二、详细说明 前文说了从 Node.js v8.10.0 开始就已经支持了 async/await 语法,经查该版本于 2018-03-06 发布,由于所有服务也不可能一下全切换到新版本,因此为了兼容 Node.js v6 版本的环境,需要将代码编译到 es6。但是站在现在这个 LTS 版本已经是 v12 的时间节点,完全可以排查现有使用 typescript 的 npm 组件是否都编译到 es2017,甚至探讨编译到 es2019 的可能。
此外这个内存泄漏问题是从哪个版本开始有的,现在是否解决了呢?编写可验证的内存泄漏的代码如下:
1 2 3 4 5 6 7 8 9 10 11 12 13 14 15 16 17 18 19 20 const heapdump = require ('heapdump' )class Async { async run ( return null ; } } const run = async ( for (let index = 0 ; index < 10000000 ; index++) { if (index % 1000000 === 0 ) console .log (Math .floor (process.memoryUsage ().heapUsed / 10000 ), index); const doer = new Async (); await doer.run (); } heapdump.writeSnapshot ((err, filename ) => { console .log ("Heap dump written to" , filename); }); }; run ();
1 2 3 4 5 6 7 8 9 10 11 12 13 14 15 16 17 18 19 20 21 22 23 24 25 26 27 28 29 30 var __awaiter = (this && this .__awaiter ) || function (thisArg, _arguments, P, generator ) { function adopt (value ) { return value instanceof P ? value : new P (function (resolve ) { resolve (value); }); } return new (P || (P = Promise ))(function (resolve, reject ) { function fulfilled (value ) { try { step (generator.next (value)); } catch (e) { reject (e); } } function rejected (value ) { try { step (generator["throw" ](value)); } catch (e) { reject (e); } } function step (result ) { result.done ? resolve (result.value ) : adopt (result.value ).then (fulfilled, rejected); } step ((generator = generator.apply (thisArg, _arguments || [])).next ()); }); }; class Async { run ( return __awaiter (this , void 0 , void 0 , function * () { return null ; }); } } const run = (__awaiter (this , void 0 , void 0 , function * () { const now = Date .now (); console .log ('循环总次数: ' , 10000000 ); for (let index = 0 ; index < 10000000 ; index++) { if (index % 1000000 === 0 ) { console .log ('第 %d 次循环,此时内存为 %d' , index, Math .floor (process.memoryUsage ().heapUsed / 1000000 )); } const instance = new Async (); yield instance.run (); } console .log ('总耗时: %d 秒' , (Date .now () - now) / 1000 ); }); run ();
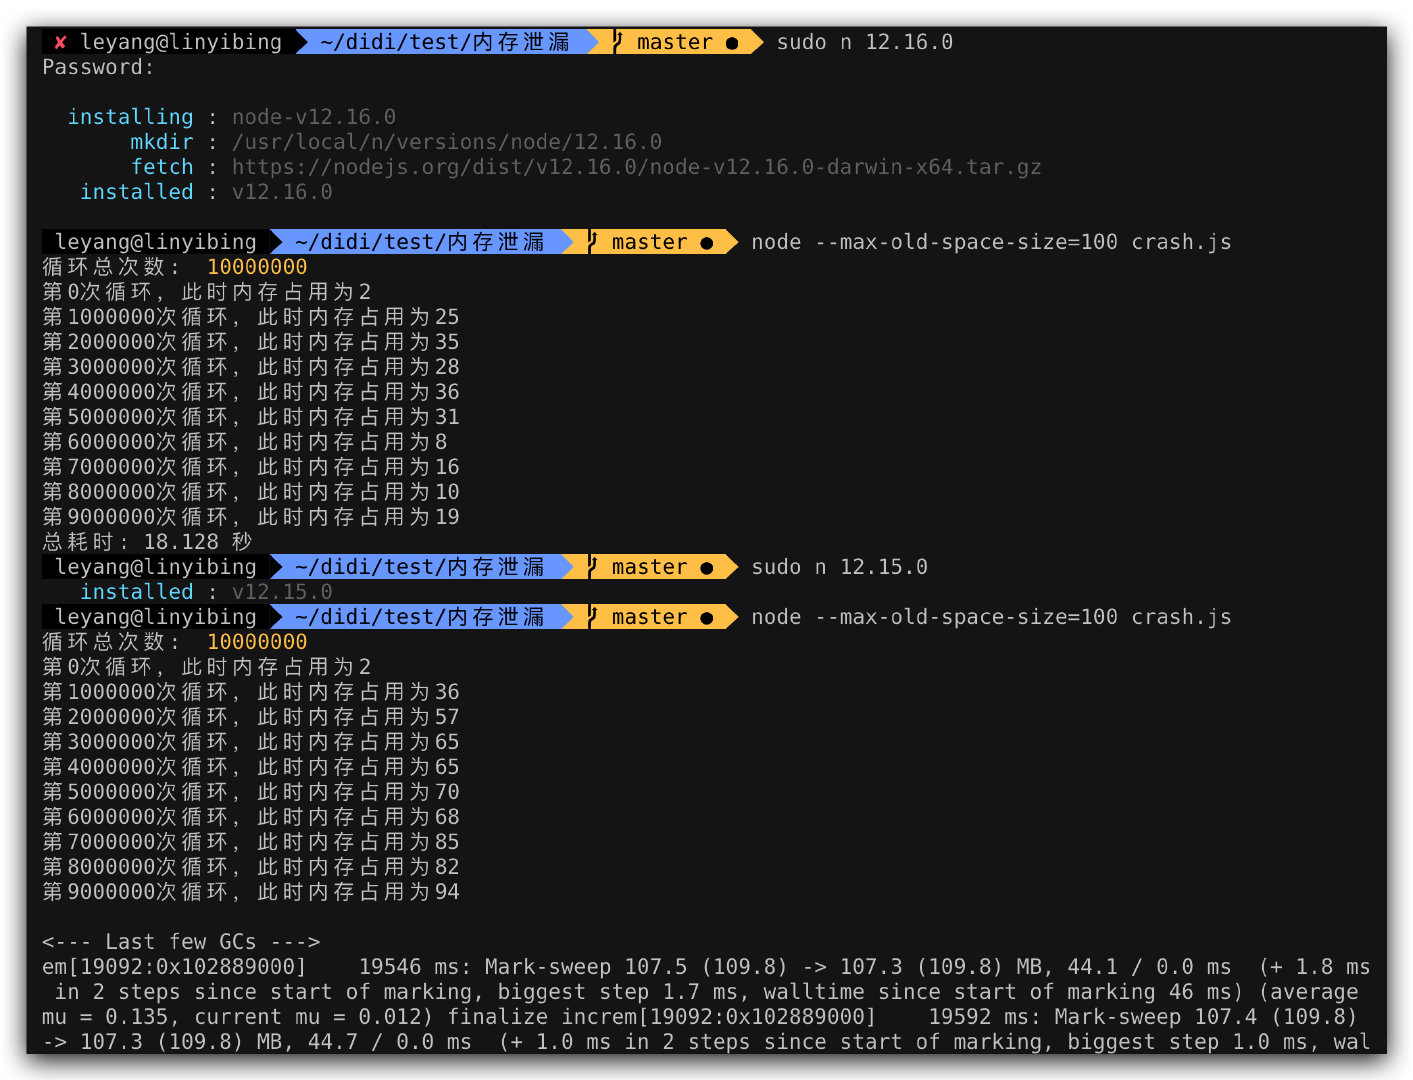
经过二分排查,发现该泄漏问题从 v11.0.0 引入,在 v12.16.0 解决;内存泄漏版本执行脚本时,内存占用逐步递增直到 crash,而未泄漏版本则会及时回收内存。
根本原因 根本原因是 v8 的一个 bug,相关链接:
v8 issue: https://bugs.chromium.org/p/v8/issues/detail?id=10031
v8 commit: https://chromium.googlesource.com/v8/v8.git/+/d3a1a5b6c4916f22e076e3349ed3619bfb014f29
node issue: https://github.com/nodejs/node/issues/30753
node commit: https://github.com/nodejs/node/pull/31005/files
改进后的代码,在分配新增 WeakArrayList 数组时,即使返回没有空闲数组的标记( kNoEmptySlotsMarker ),仍需要调用 ScanForEmptySlots 方法重新扫描一次数组,因为该数组元素有可能有被 GC 回收,这些被回收的元素是可以重复使用的;仅当返回 kNoEmptySlotsMarker 且数组中没有被 GC 回收的元素,才真正执行新增逻辑:
1 2 3 4 5 6 7 8 9 10 11 12 13 14 15 16 17 18 19 20 21 22 23 24 25 26 27 28 29 30 31 32 33 34 35 36 37 38 39 40 41 42 43 44 45 46 47 48 49 50 51 52 53 54 55 56 57 58 59 60 61 62 63 64 Handle<WeakArrayList> PrototypeUsers::Add (Isolate* isolate, Handle<WeakArrayList> array, Handle<Map> value, int * assigned_index) int length = array->length (); if (length == 0 ) { array = WeakArrayList::EnsureSpace (isolate, array, kFirstIndex + 1 ); set_empty_slot_index (*array, kNoEmptySlotsMarker); array->Set (kFirstIndex, HeapObjectReference::Weak (*value)); array->set_length (kFirstIndex + 1 ); if (assigned_index != nullptr ) *assigned_index = kFirstIndex; return array; } if (!array->IsFull ()) { array->Set (length, HeapObjectReference::Weak (*value)); array->set_length (length + 1 ); if (assigned_index != nullptr ) *assigned_index = length; return array; } int empty_slot = Smi::ToInt (empty_slot_index (*array)); if (empty_slot == kNoEmptySlotsMarker) { PrototypeUsers::ScanForEmptySlots (*array); empty_slot = Smi::ToInt (empty_slot_index (*array)); } if (empty_slot != kNoEmptySlotsMarker) { DCHECK_GE (empty_slot, kFirstIndex); CHECK_LT (empty_slot, array->length ()); int next_empty_slot = array->Get (empty_slot).ToSmi ().value (); array->Set (empty_slot, HeapObjectReference::Weak (*value)); if (assigned_index != nullptr ) *assigned_index = empty_slot; set_empty_slot_index (*array, next_empty_slot); return array; } else { DCHECK_EQ (empty_slot, kNoEmptySlotsMarker); } array = WeakArrayList::EnsureSpace (isolate, array, length + 1 ); array->Set (length, HeapObjectReference::Weak (*value)); array->set_length (length + 1 ); if (assigned_index != nullptr ) *assigned_index = length; return array; } void PrototypeUsers::ScanForEmptySlots (WeakArrayList array) for (int i = kFirstIndex; i < array.length (); i++) { if (array.Get (i)->IsCleared ()) { PrototypeUsers::MarkSlotEmpty (array, i); } } }
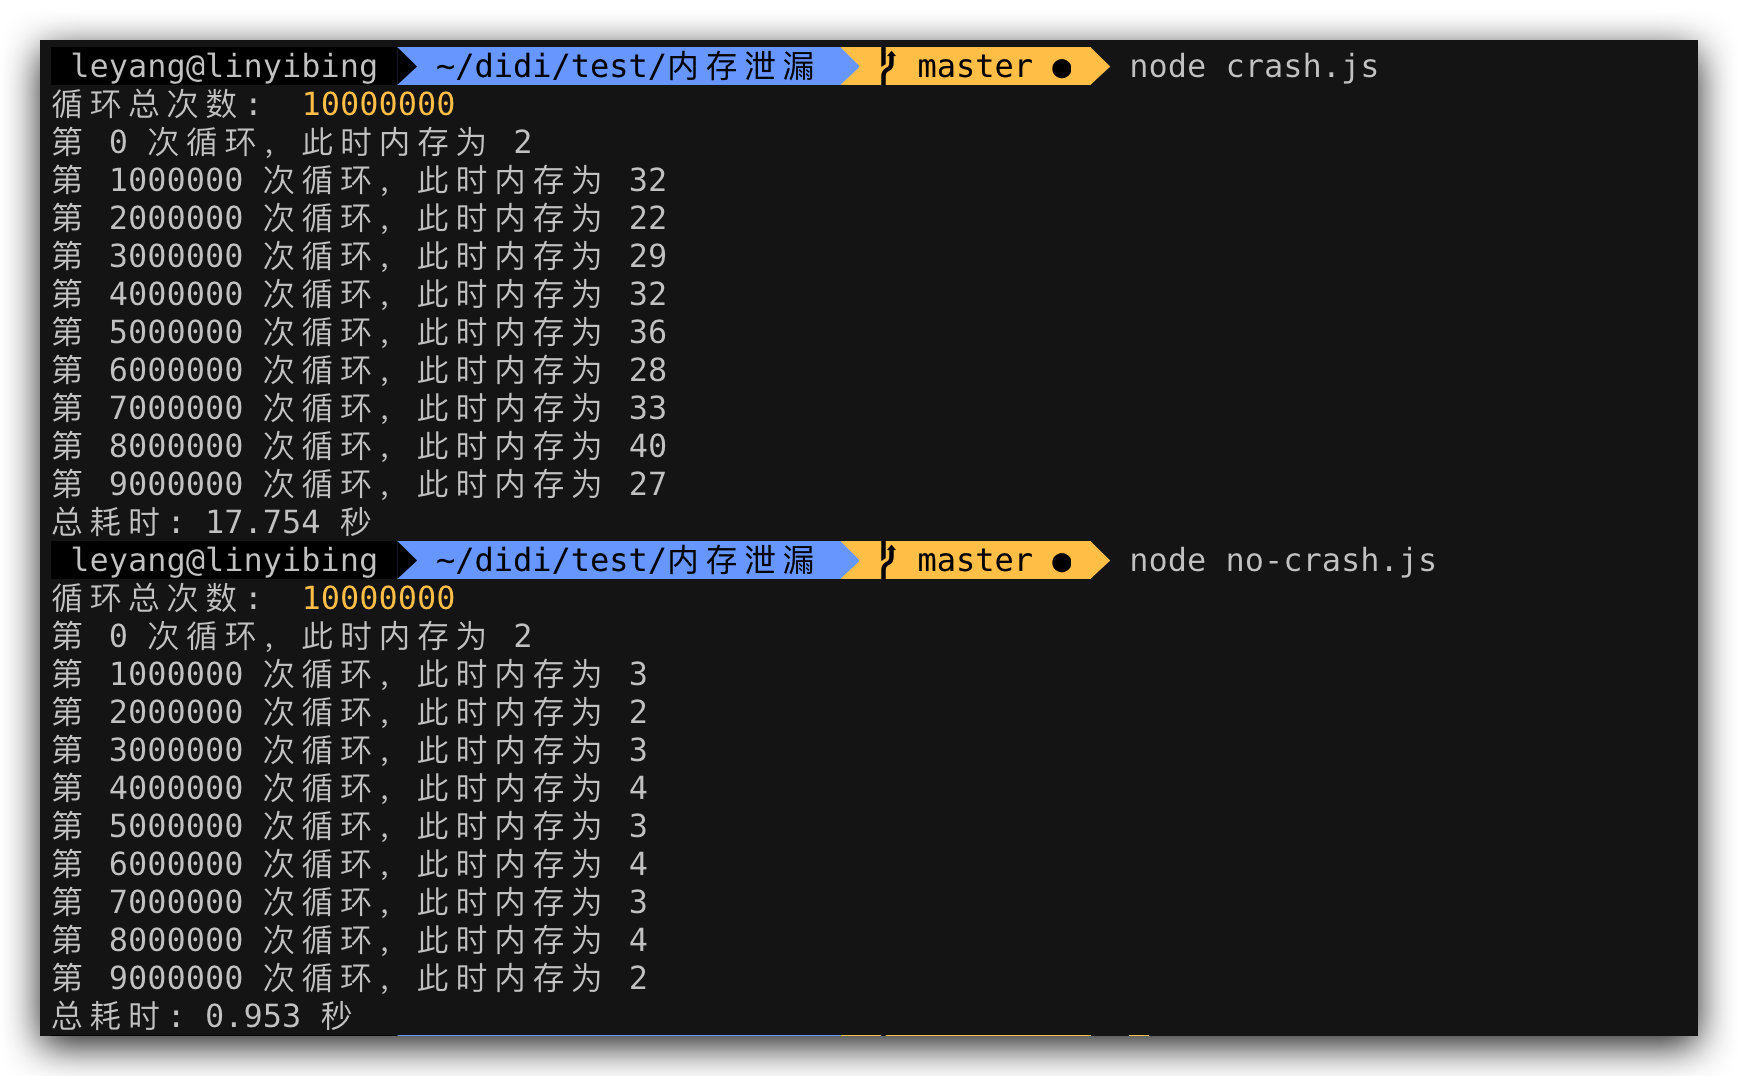
不止内存泄漏 在我测试内存泄漏时,有一个发现,执行发生内存泄漏时的代码(前文的 leak.js)和未发生内存泄漏时的代码(前文的 node-leak.js)时,即使在已经修复该问题的 Node.js v12.16.2 版本下,generator 语法仍然有两个问题:
内存回收效率低,导致执行完后,仍有相当大的内存占用;
执行效率非常慢,async/await 版本仅需要 0.953 秒,而 generator 却需要 17.754 秒;
这说明,相比 generator 语法,async/await 语法无论从执行效率还是内存占用方面都有压倒性优势。那么执行效率对比如何呢?上 benchmark 工具比划比划:
1 2 3 4 5 6 7 8 9 10 11 12 13 14 15 16 17 18 19 20 21 22 23 24 25 26 27 28 29 30 31 32 33 34 35 36 37 38 39 40 41 42 43 44 45 46 const __awaiter = (this && this .__awaiter ) || function (thisArg, _arguments, P, generator ) { function adopt (value ) { return value instanceof P ? value : new P (function (resolve ) { resolve (value); }); } return new (P || (P = Promise ))(function (resolve, reject ) { function fulfilled (value ) { try { step (generator.next (value)); } catch (e) { reject (e); } } function rejected (value ) { try { step (generator["throw" ](value)); } catch (e) { reject (e); } } function step (result ) { result.done ? resolve (result.value ) : adopt (result.value ).then (fulfilled, rejected); } step ((generator = generator.apply (thisArg, _arguments || [])).next ()); }); }; const Benchmark = require ('benchmark' );const suite = new Benchmark .Suite ;suite .add ('generator' , { defer : true , fn : function (deferred ) { (function ( return __awaiter (this , void 0 , void 0 , function * () { yield Promise .resolve (1 ); yield Promise .resolve (2 ); deferred.resolve (); }); })(); } }) .add ('async/await' , { defer : true , fn : function (deferred ) { (async function ( await Promise .resolve (1 ); await Promise .resolve (2 ); deferred.resolve (); })() } }) .on ('cycle' , function (event ) { console .log (String (event.target )); }) .run ({ 'async' : false });
Node.js v12.16.2 的结果:
1
2
generator x 443 ,891 ops/sec ±4 .12 % (75 runs sampled) async/await x 4 ,567 ,163 ops/sec ±1 .96 % (79 runs sampled)
generator 每秒执行了 516,178 次操作,而 async/await 每秒执行了 4,531,357 次操作,后者是前者的 10 倍多!我们看看其它 Node.js 版本表现如何:
电脑配置:MacBook Pro (13-inch, 2017, Two Thunderbolt 3 ports)
Node.js 版本
generator
async/await
倍数
12.16.2
443,891
4,567,163
10.29
11.15.0
424,073
680,795
1.60
10.20.1
427,799
669,910
1.57
9.11.2
275,526
500,487
1.82
8.17.0
281,571
535,317
1.90
二者执行效率和 Node.js 版本成正比,而 Node.js v12 来了一次大跃进,直接高了一个数量级,这个得益于 v8 7.2 的一个新特性 ,官网用了整整一篇文章 说明,有兴趣的可以看看。
Chrome 也中招了吗?
目前最新版:版本 81.0.4044.113(正式版本) (64 位) 已经修复这个问题
既然是 v8 的问题,那么 chrome 浏览器也是有这个问题的,打开空白标签页,执行前文给出的 leak.js 代码:
可发现,chrome 下也会有内存泄漏问题,只不过 chrome 页面上的代码运行一般不会有密集地、重复地执行某段『导致内存泄漏』的代码,因此该问题在 chrome 端不容易被察觉。
总结 没想到一个小小的语法转译也会造成如此严重的内存泄漏问题,且一个 V8 底层小小的 bug 在上层使用时会被放大得如此严重。但是只要我们不放过每一个可疑点,深入排查总会有意想不到的收获!