Debugging a Node.js Memory Leak - The Unexpected Culprit
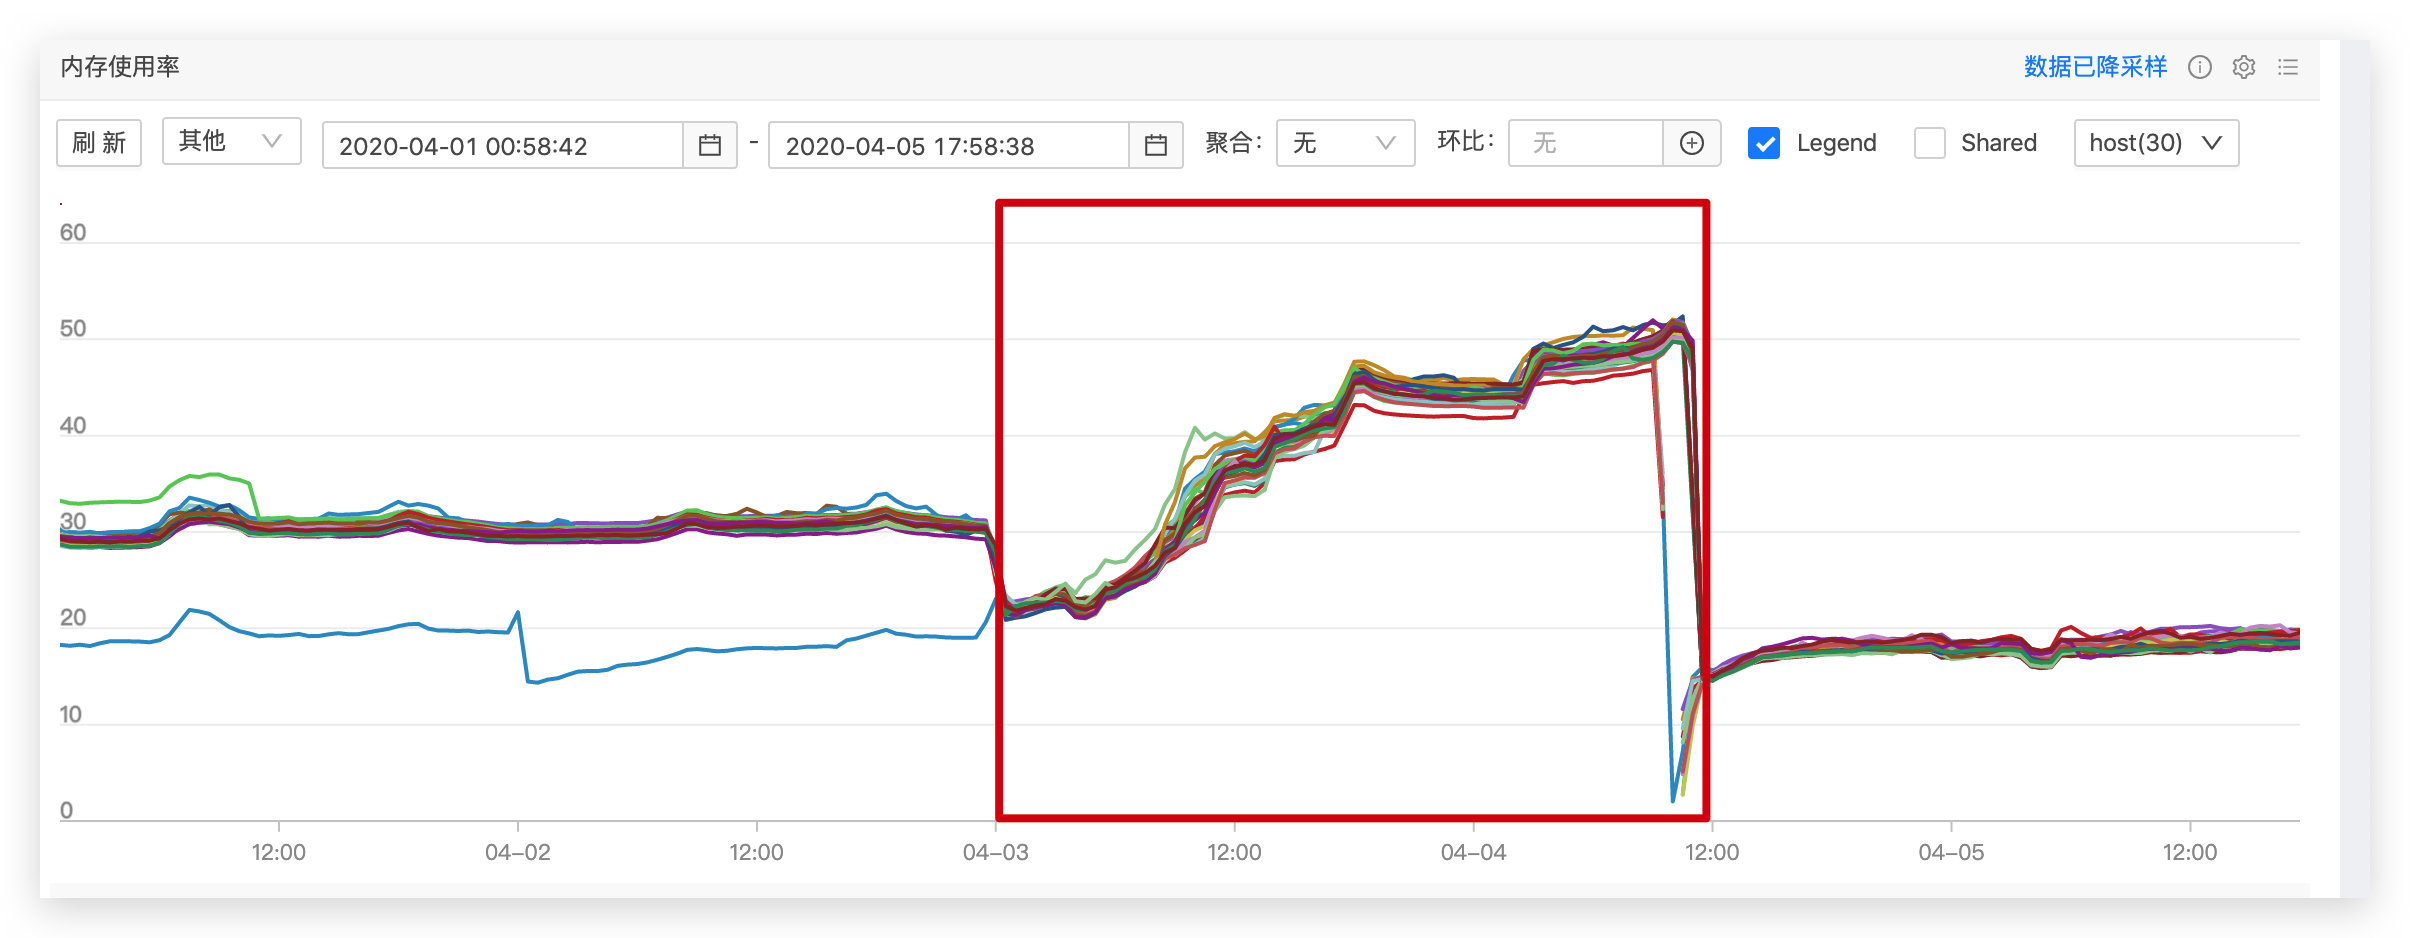
Our team recently migrated two projects to degg 2.0, and both exhibited serious memory leak issues. Here I’ll use the tracking service I maintain as an example for debugging. After going live, memory growth looked like the chart below—the red box marks the degg 2.0 production runtime window. Within just 36 hours, memory had grown to 50%, while it normally stabilized at 20%-30%, clearly indicating a memory leak.
Background
Our team recently migrated two projects to degg 2.0, and both exhibited serious memory leak issues. Here I’ll use the tracking service I maintain as an example. After going live, memory growth looked like the chart below—the red box marks the degg 2.0 production runtime window. Within just 36 hours, memory had grown to 50%, while it normally stabilized at 20%-30%, clearly indicating a memory leak.
Debugging Approach
Since both services on degg 2.0 had memory leaks, we initially narrowed the investigation to base components introduced or rewritten in degg 2.0, with the primary suspect being the nodex-logger component. To debug the leak, we needed heap snapshots (heapsnapshot). For how to obtain them, see: Node Crime Scene Investigation — Quickly Locating Production Memory Leaks.
Debugging Process
1. Obtaining Heap Snapshots
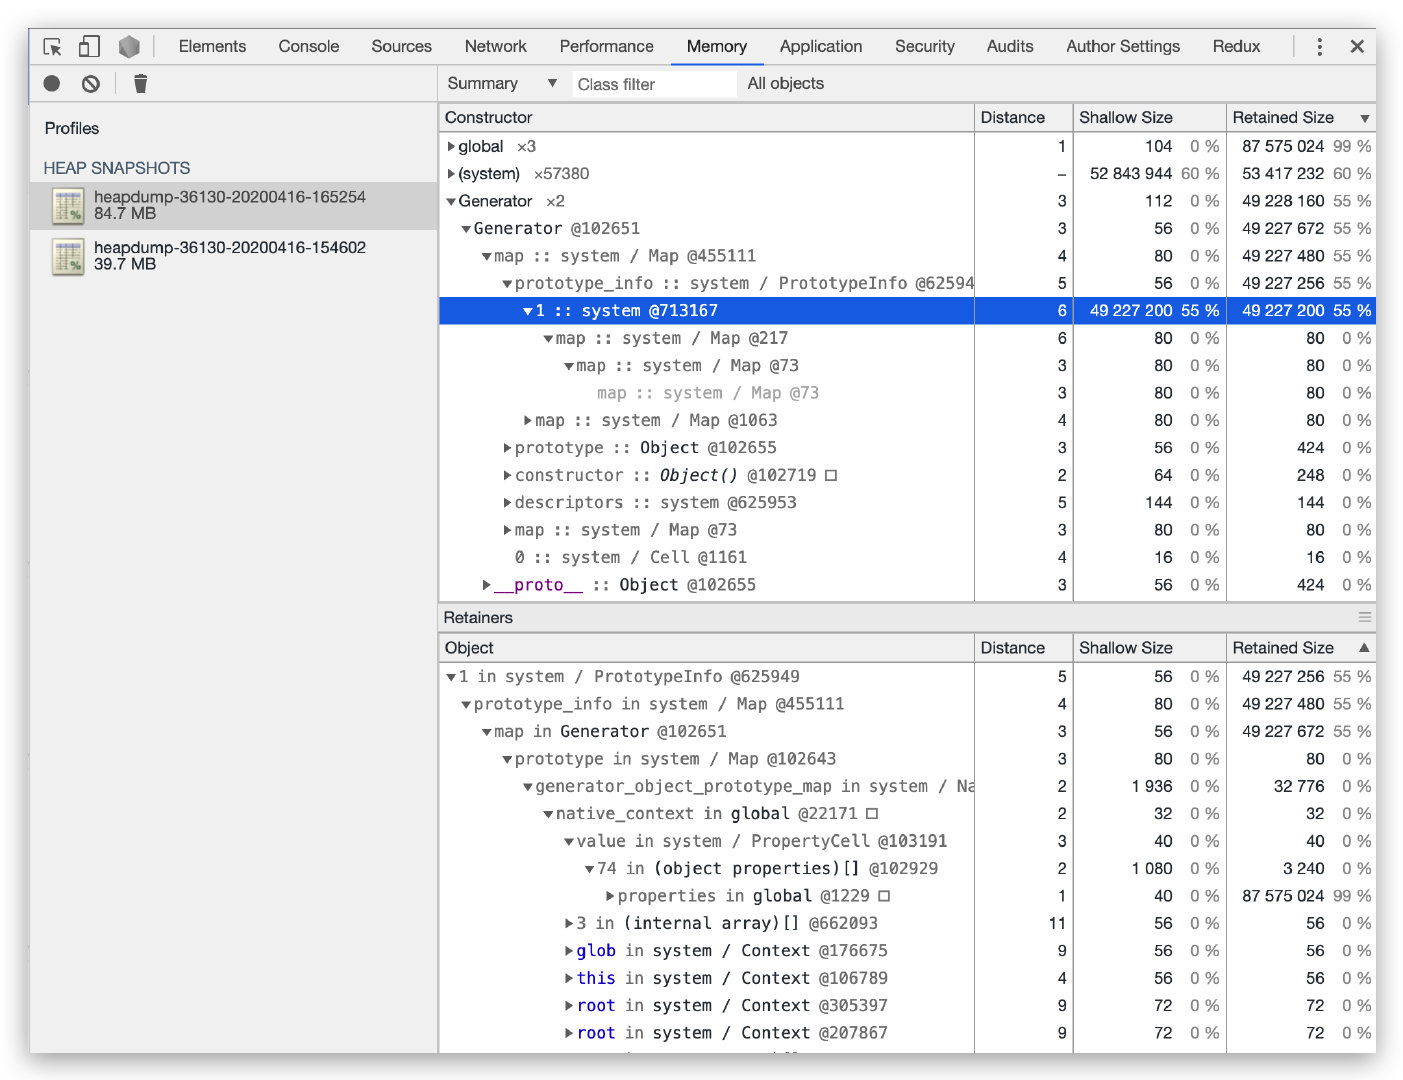
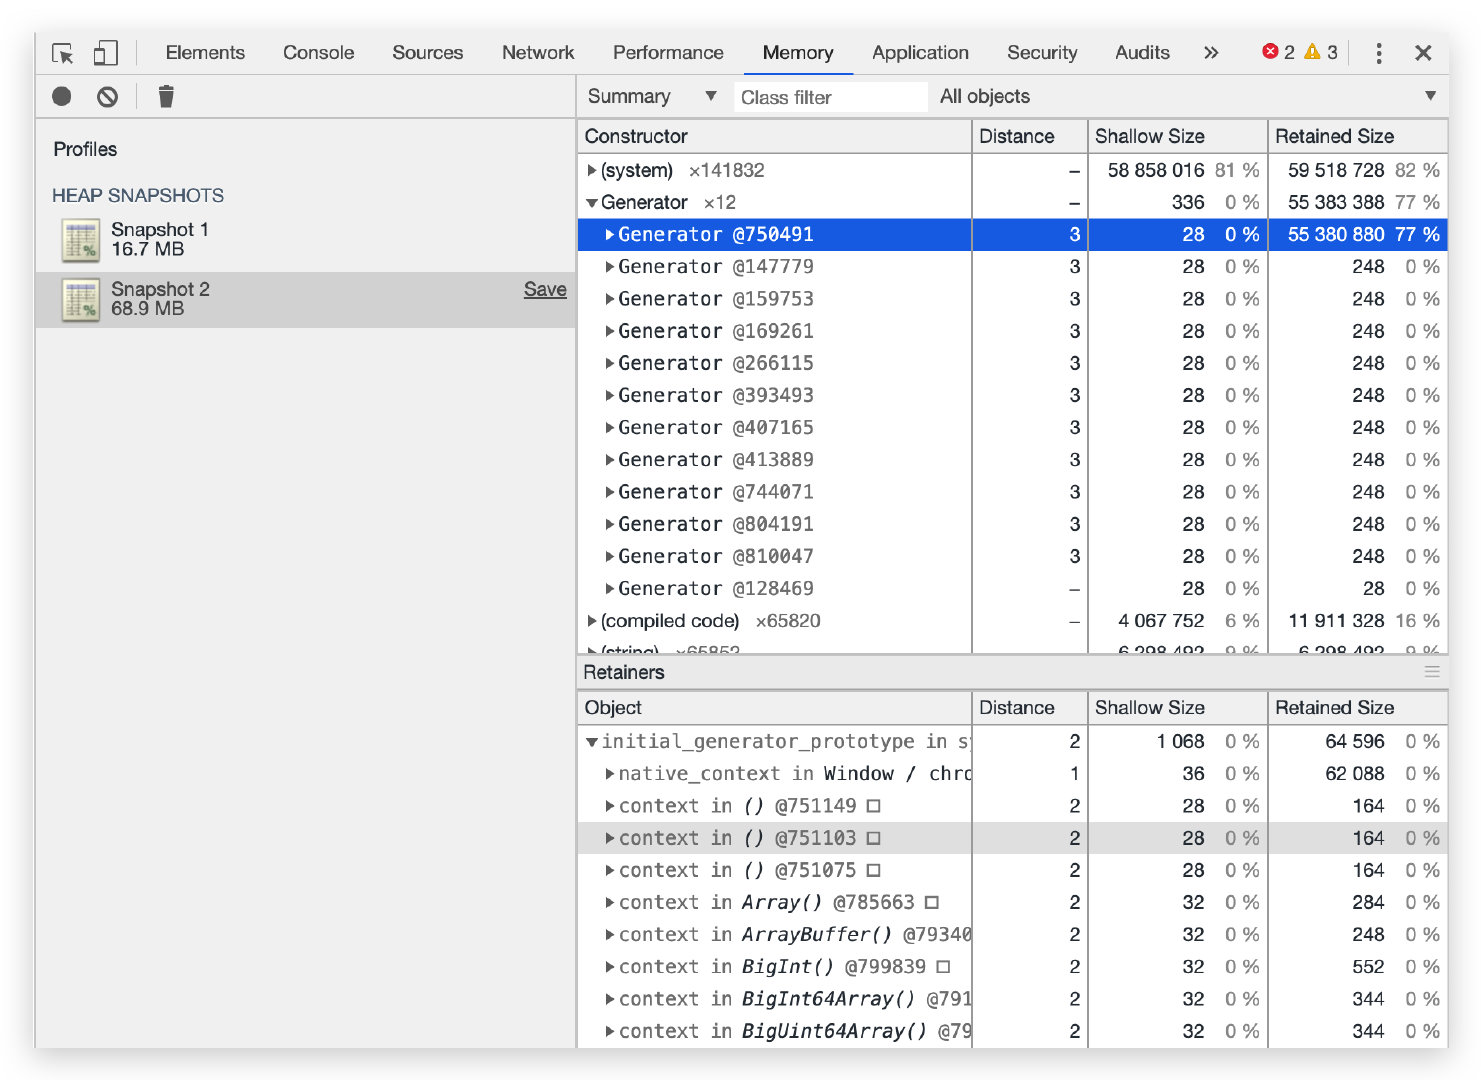
Using alinode to capture heap snapshots. After service startup, we warmed up with light traffic for a couple of minutes and recorded the first snapshot (2020-4-16-16:52). Then we applied pressure at 125 qps, and after about an hour (2020-4-16-15:46) captured the second snapshot. Loading both in Chrome DevTools, as shown below, the snapshot file grew by 45MB in just one hour—the initial size was only 39.7MB. Sorting by Retained Size, we quickly spotted a “suspect”: generator, occupying 55% of the size while Shallow Size was 0%. Expanding item by item, we pinpointed the highlighted row, but going deeper showed 0%—the trail went cold.
Staring at generator and thinking—my service code doesn’t use generator syntax, so why were generator objects leaking? I turned my attention to node_modules. Since I’d been optimizing the nodex-kafka component and sometimes editing code directly in node_modules for debugging, a piece of code at the top of almost every file caught my attention:
1 | ; |
This code is the compiled output of TypeScript source. Since the code uses async/await syntax, everything compiles to __awaiter form:
1 | // Before compilation |
A generator memory leak issue #30753 generator functions - memory leak also caught my attention—the Node.js version and leak behavior closely matched my problem. Searching for all __awaiter strings in node_modules, I found 3 modules with this compiled code:
nodex-loggernodex-kafkanodex-apollo
Since their tsconfig.json target was set to es6, generators were used to simulate async/await. But Node.js has supported 100% of ES2017 features since v8.10.0, so there was no need to compile async/await. I changed all 3 modules’ target to es2017 so tsc wouldn’t compile async/await syntax.
2. Verification
Repeating the heap snapshot steps, I was amazed to find that even after a full day, memory didn’t grow, and generators weren’t holding unreleased memory:
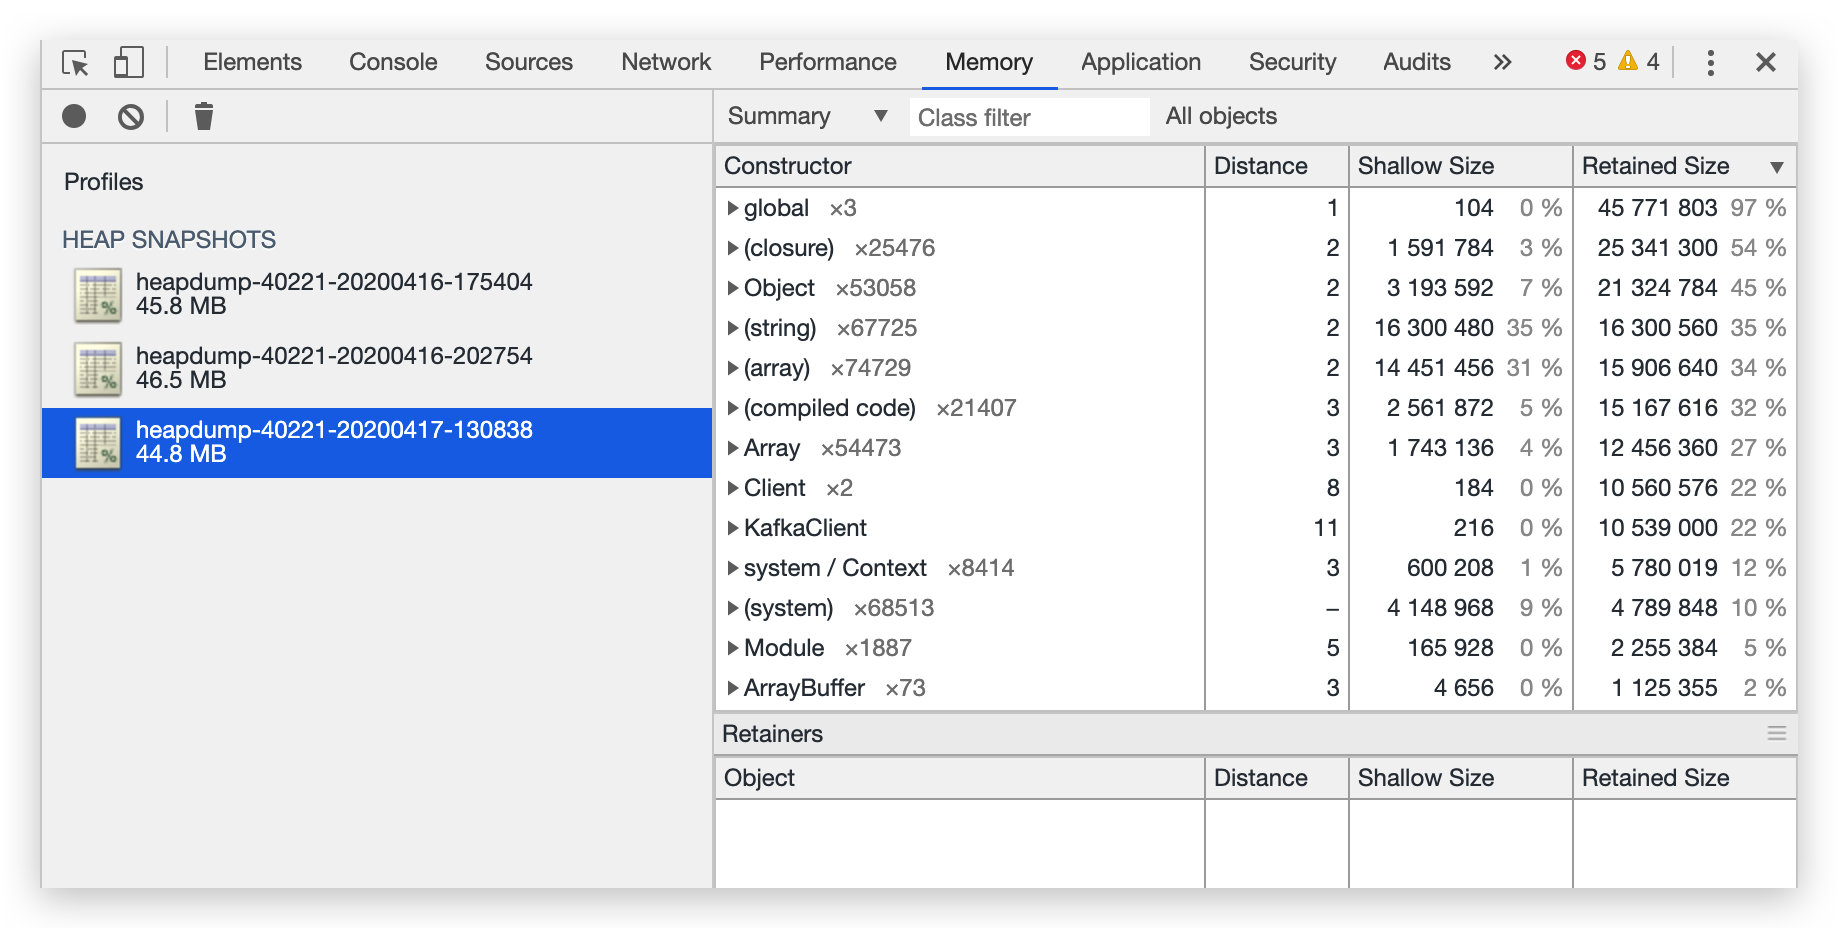
The memory leak was resolved! But how can we avoid this issue?
Prevention
1. Steps
Step 1
This issue only exists in specific Node.js versions. Use Node.js outside the range [v11.0.0 - v12.16.0) to prevent second-party and third-party npm components’ generator syntax from causing issues.
Step 2
Compile your TypeScript with target es2017 or higher, and prefer async/await over generator syntax to prevent others using [v11.0.0 - v12.16.0) from experiencing memory leaks when importing your npm components.
2. Detailed Explanation
As mentioned, Node.js v8.10.0 (released 2018-03-06) already supports async/await. Since not all services could switch immediately, compiling to es6 was necessary for Node.js v6 compatibility. But now, with LTS at v12, we should check whether all TypeScript npm components compile to es2017 or even explore es2019.
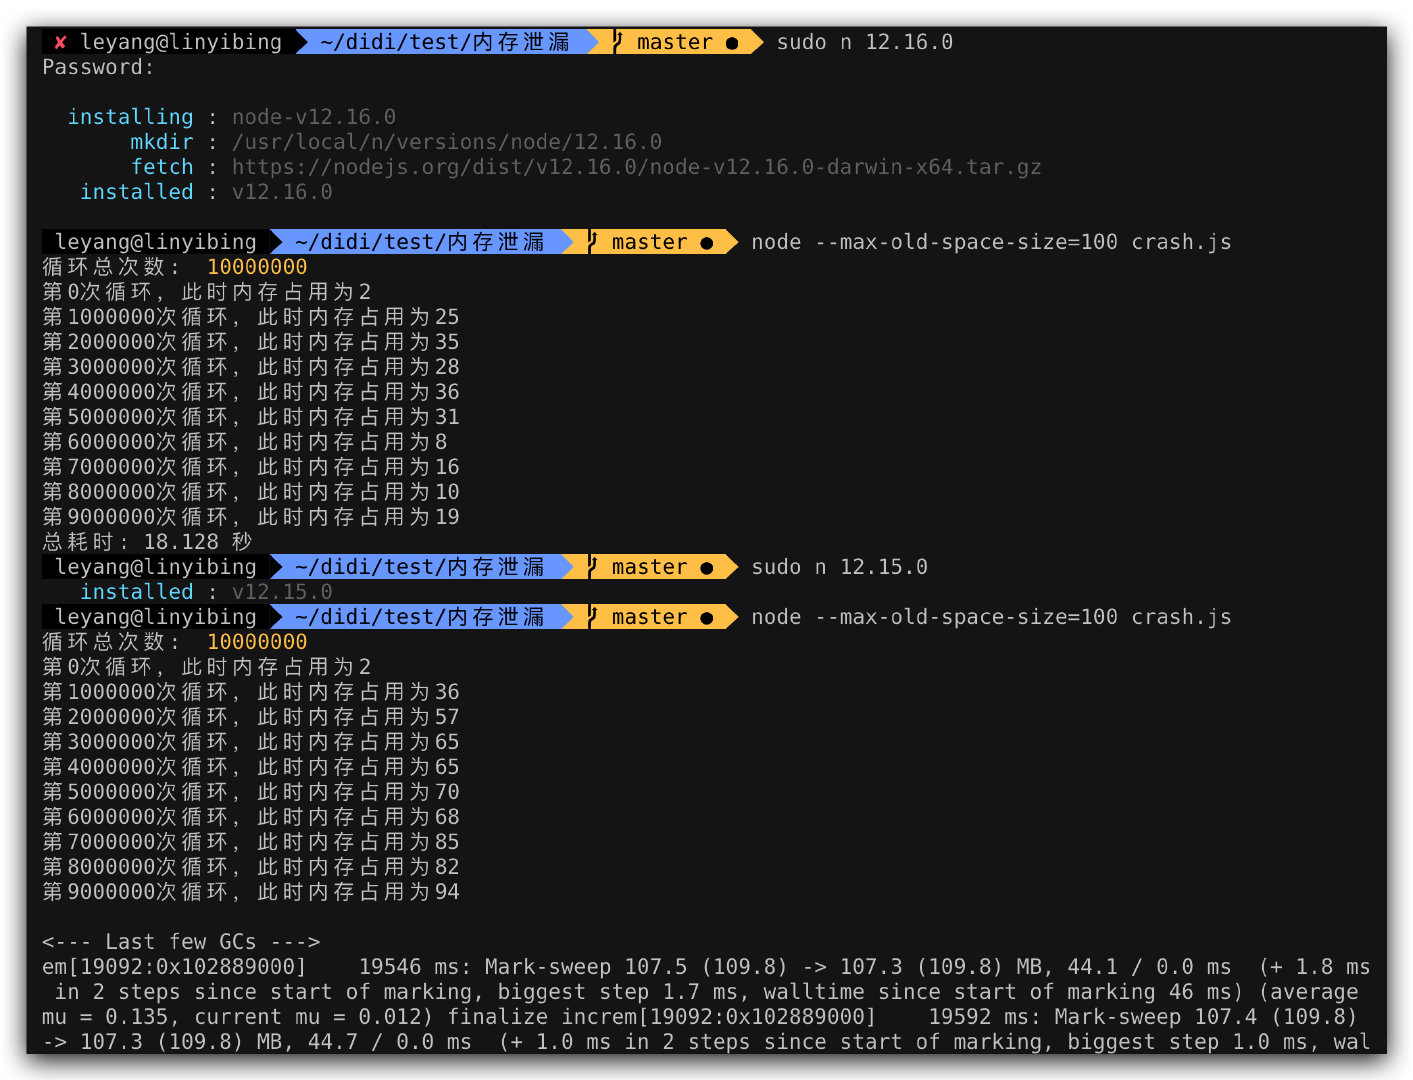
Through binary search, I found the leak was introduced in v11.0.0 and fixed in v12.16.0. During the leak, memory steadily increased until crash; in fixed versions, memory was reclaimed properly.
Root Cause
The root cause was a V8 bug. Related links:
- V8 issue: https://bugs.chromium.org/p/v8/issues/detail?id=10031
- V8 commit: https://chromium.googlesource.com/v8/v8.git/+/d3a1a5b6c4916f22e076e3349ed3619bfb014f29
- Node issue: https://github.com/nodejs/node/issues/30753
- Node commit: https://github.com/nodejs/node/pull/31005/files
The improved code: when allocating a new WeakArrayList array, even if it returns kNoEmptySlotsMarker (no free slots), it still calls ScanForEmptySlots to rescan, since some elements may have been GC’d and can be reused. Only when kNoEmptySlotsMarker is returned AND no GC’d elements exist does it truly grow:
1 | // https://github.com/targos/node/blob/cceb2a87295724b7aa843363460ffcd10cda05b5/deps/v8/src/objects/objects.cc#L4042 |
Beyond Memory Leaks
During testing, I discovered that even on the fixed Node.js v12.16.2, generator syntax still had two problems:
- Low memory reclamation efficiency, leaving significant memory usage after completion
- Very slow execution—
async/awaittook only 0.953 seconds vs. generator’s 17.754 seconds
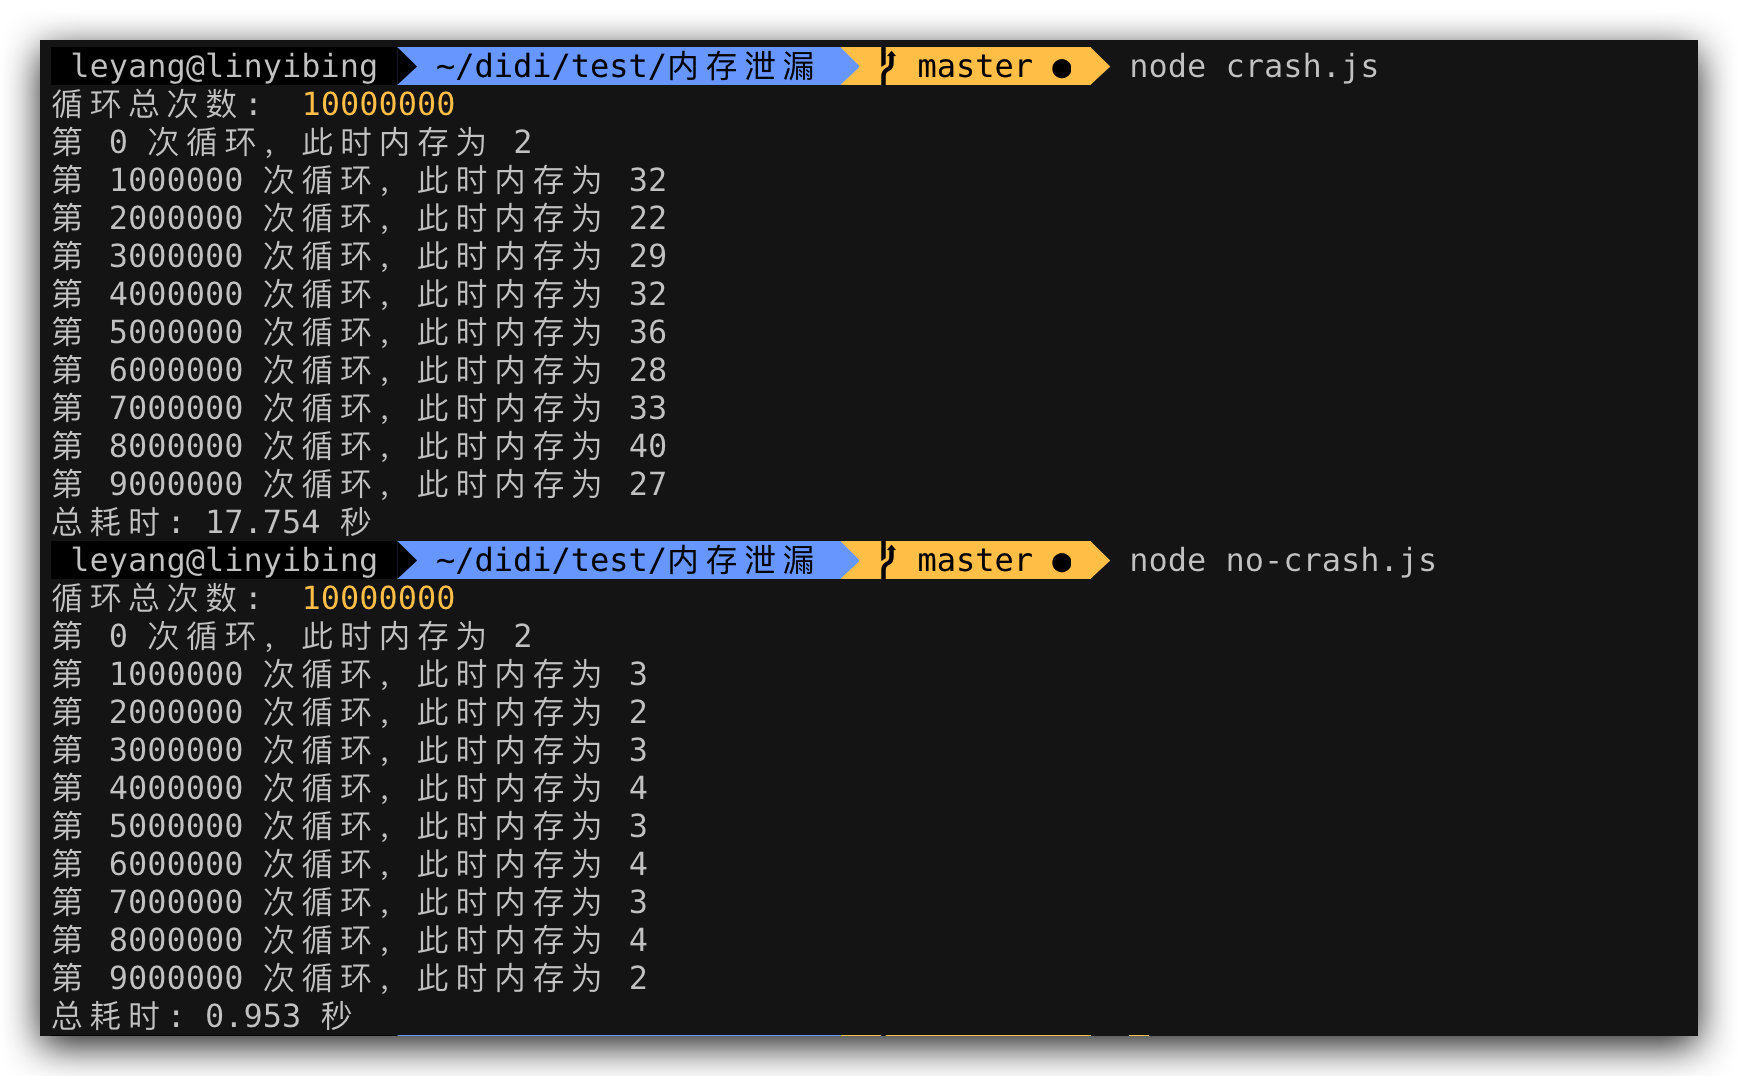
This shows async/await has overwhelming advantages over generators in both execution efficiency and memory usage. Benchmark results:
Machine: MacBook Pro (13-inch, 2017, Two Thunderbolt 3 ports)
| Node.js Version | generator | async/await | Multiple |
|---|---|---|---|
| 12.16.2 | 443,891 | 4,567,163 | 10.29 |
| 11.15.0 | 424,073 | 680,795 | 1.60 |
| 10.20.1 | 427,799 | 669,910 | 1.57 |
| 9.11.2 | 275,526 | 500,487 | 1.82 |
| 8.17.0 | 281,571 | 535,317 | 1.90 |
Performance scales with Node.js version, with v12 making a quantum leap—an entire order of magnitude higher. This was thanks to a V8 7.2 new feature, with a full article explaining it.
Was Chrome Affected Too?
The latest version
81.0.4044.113 (Official Build) (64-bit)has fixed this issue
Since it’s a V8 bug, Chrome browsers also had this issue. Opening a blank tab and running the leak.js code:
Chrome also exhibits the memory leak, though browser-side code rarely has intensive, repetitive execution of “leak-causing” code, making it harder to notice.
Conclusion
Who would have thought a small syntax transpilation could cause such a severe memory leak, and a tiny V8 bug could be amplified so dramatically at the application level. But as long as we don’t overlook any suspicious point and investigate deeply, there are always unexpected discoveries!
Debugging a Node.js Memory Leak - The Unexpected Culprit
http://quanru.github.io/2020/04/20/Debugging-a-Node.js-Memory-Leak-The-Unexpected-Culprit