Chrome 谜一样卡死的排查方法
遇到莫名卡死问题,如何正确地排查
最近由于 Chrome 浏览器升级,触发了一个埋点 SDK 的潜在问题,目前埋点 SDK 方面已经跟进解决,详细原因可见文章《Chrome 83 下千帆工作台卡死的问题》。
一切好像没什么问题,但是陆续有团队同学反馈,线上页面的确不卡了,测试环境某些操作仍然会出现卡死,而且卡死时正好会有 golden 或 omega 埋点处于 pending 状态。于是开始了排查之路~
一、线索排查
查看 pending 状态的请求:
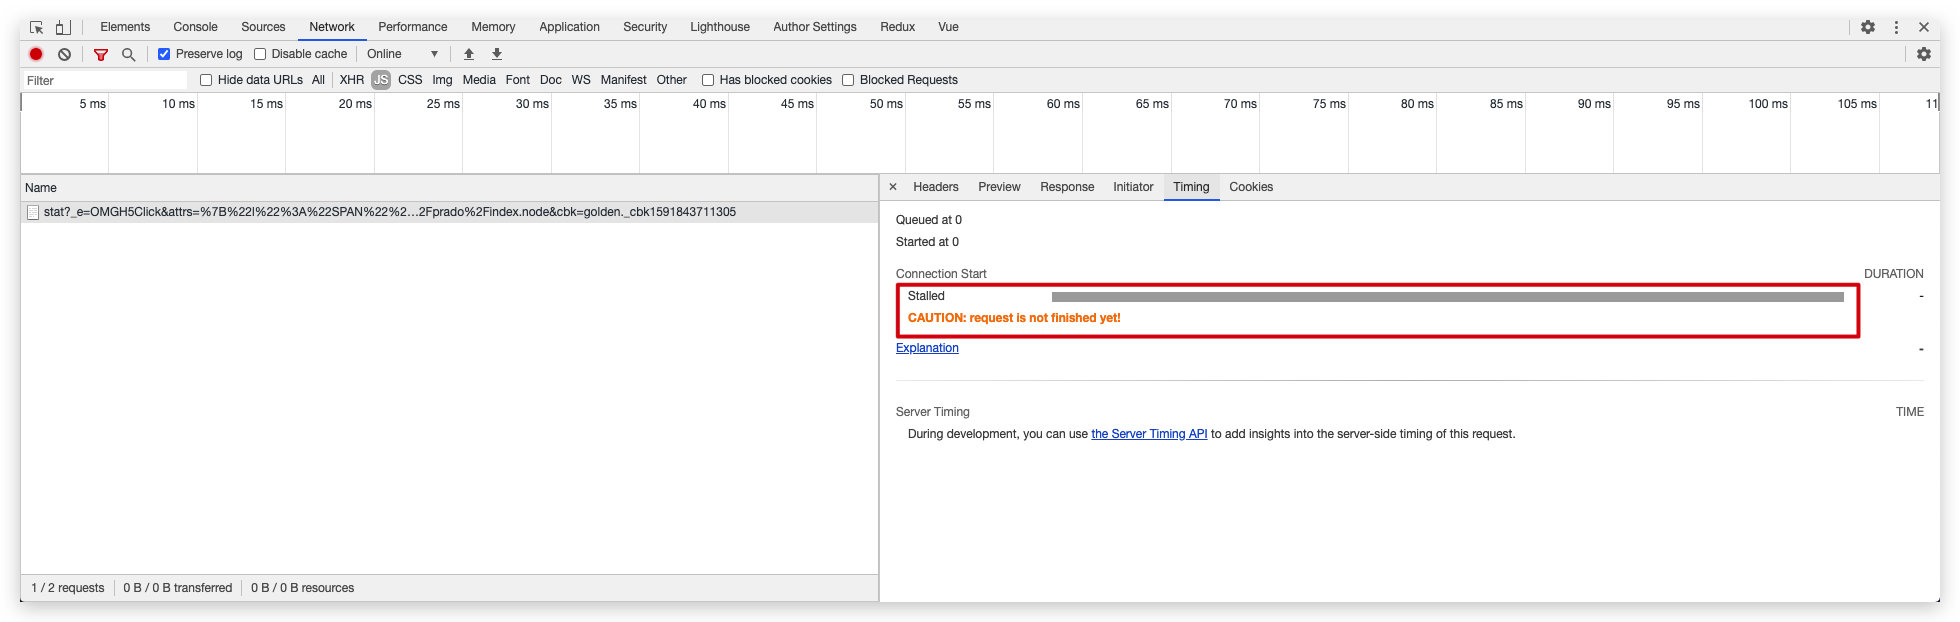
发现请求卡在了一个 “Stalled” 的状态,谷歌还贴心的给出了 “Explanation” 链接,解释如下:
Here’s more information about each of the phases you may see in the Timing tab:
Queueing
. The browser queues requests when:
- There are higher priority requests.
- There are already six TCP connections open for this origin, which is the limit. Applies to HTTP/1.0 and HTTP/1.1 only.
- The browser is briefly allocating space in the disk cache
Stalled. The request could be stalled for any of the reasons described in Queueing.
DNS Lookup. The browser is resolving the request’s IP address.
Initial connection. The browser is establishing a connection, including TCP handshakes/retries and negotiating an SSL.
Proxy negotiation. The browser is negotiating the request with a proxy server.
Request sent. The request is being sent.
ServiceWorker Preparation. The browser is starting up the service worker.
Request to ServiceWorker. The request is being sent to the service worker.
Waiting (TTFB). The browser is waiting for the first byte of a response. TTFB stands for Time To First Byte. This timing includes 1 round trip of latency and the time the server took to prepare the response.
Content Download. The browser is receiving the response.
Receiving Push. The browser is receiving data for this response via HTTP/2 Server Push.
Reading Push. The browser is reading the local data previously received.
也就是 Queueing 阶段的问题导致卡在 Stalled 状态,经查得知可以通过如下方式查看 Chrome 的运行日志,当然包括详细的网络日志。
各平台查看日志方式见 https://support.google.com/chrome/a/answer/6271282?hl=zh-Hans
以监听日志方式打开浏览器
/Applications/Google\ Chrome.app/Contents/MacOS/Google\ Chrome --enable-logging --v=1实时查看日志:
tail -f ~/Library/Application\ Support/Google/Chrome/chrome_debug.log
二、日志查看
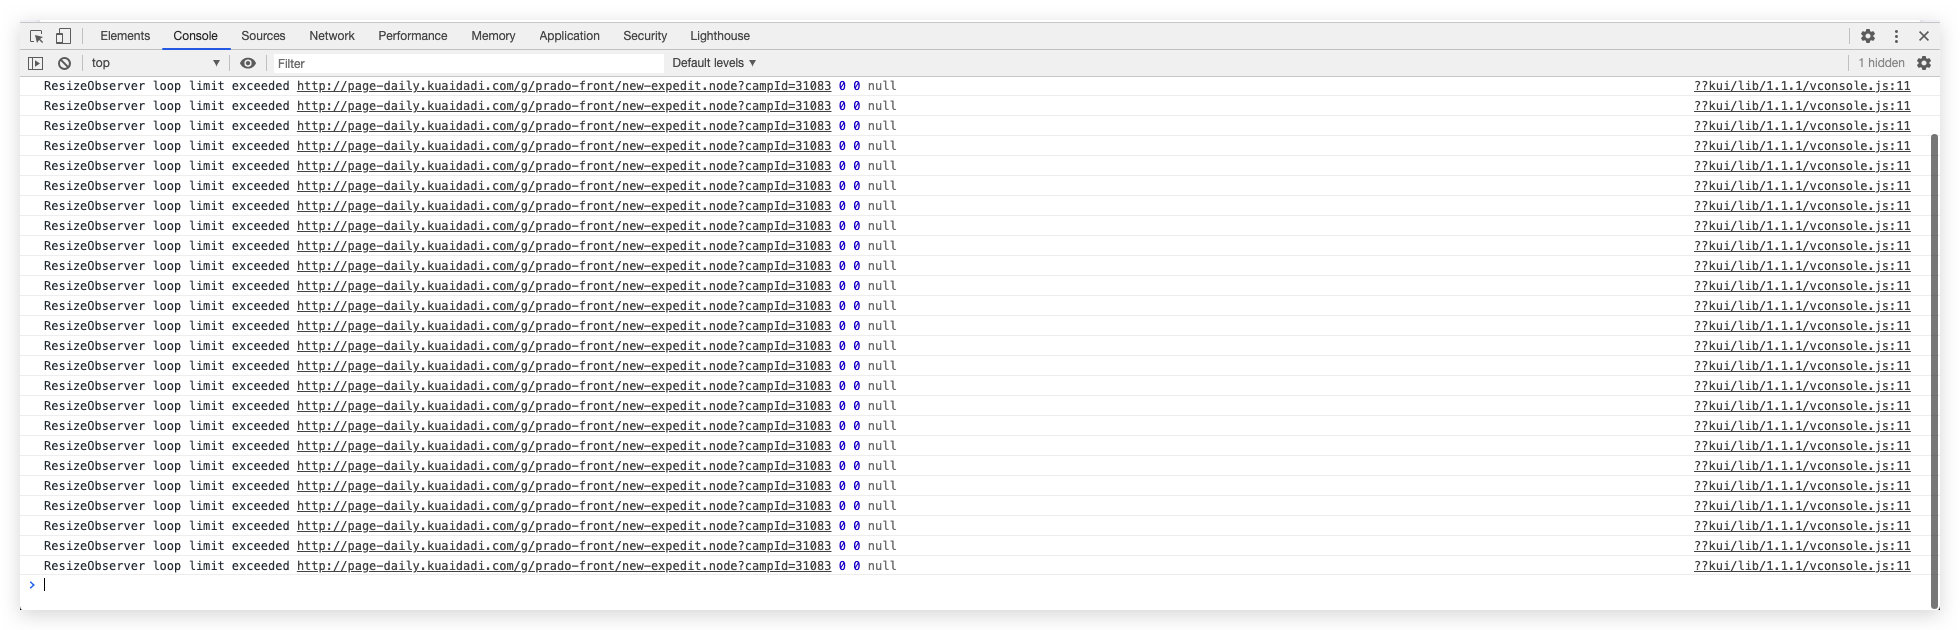
按上述方式打开浏览器,实时查看日志文件,一步一步复现步骤,日志打印如下:
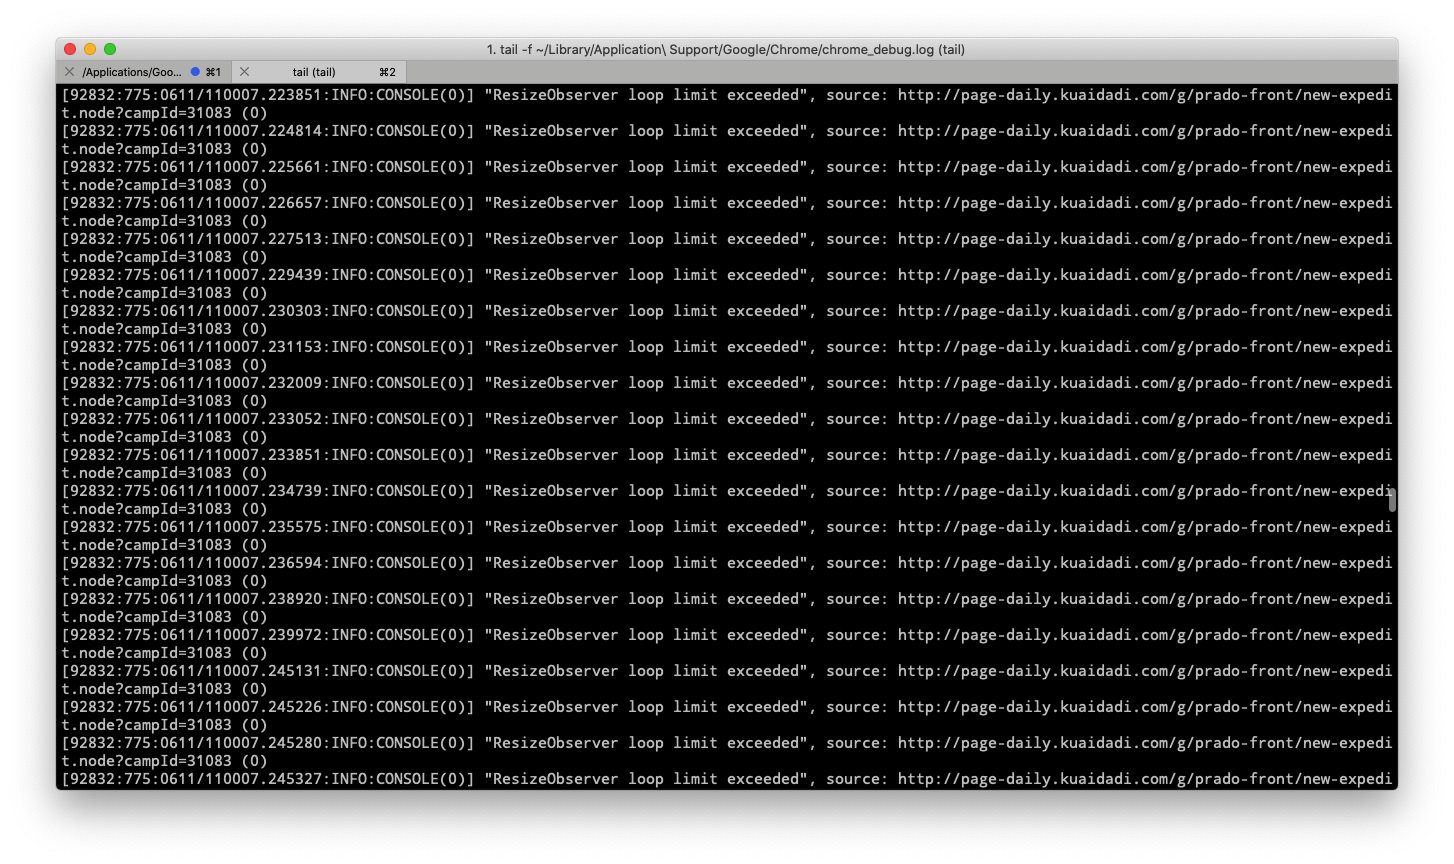
所以绕了一圈还是 “ResizeObserver” 的问题,原因在 Chrome 83 下千帆工作台卡死的问题 中也有提到,这里列两个 issue 大家有兴趣查看下:
三、推测
那么,为什么测试环境有问题,线上环境却没有呢?目前解决 Omega sdk 和 Golden sdk 问题的方法是通过如下方式重写 EventTarget.prototype.addEventListener 方法,达到过滤发送埋点请求的目的(也正是循环发送埋点请求,导致页面卡死)。
1 | EventTarget.prototype.addEventListenerBase = EventTarget.prototype.addEventListener; |
所以,还有除了 EventTarget.prototype.addEventListener 方法之外的监听没有被重写,我掐指一算,难道是 window.onerror,于是去当前卡死页面的调试控制台打印 window.onerror:
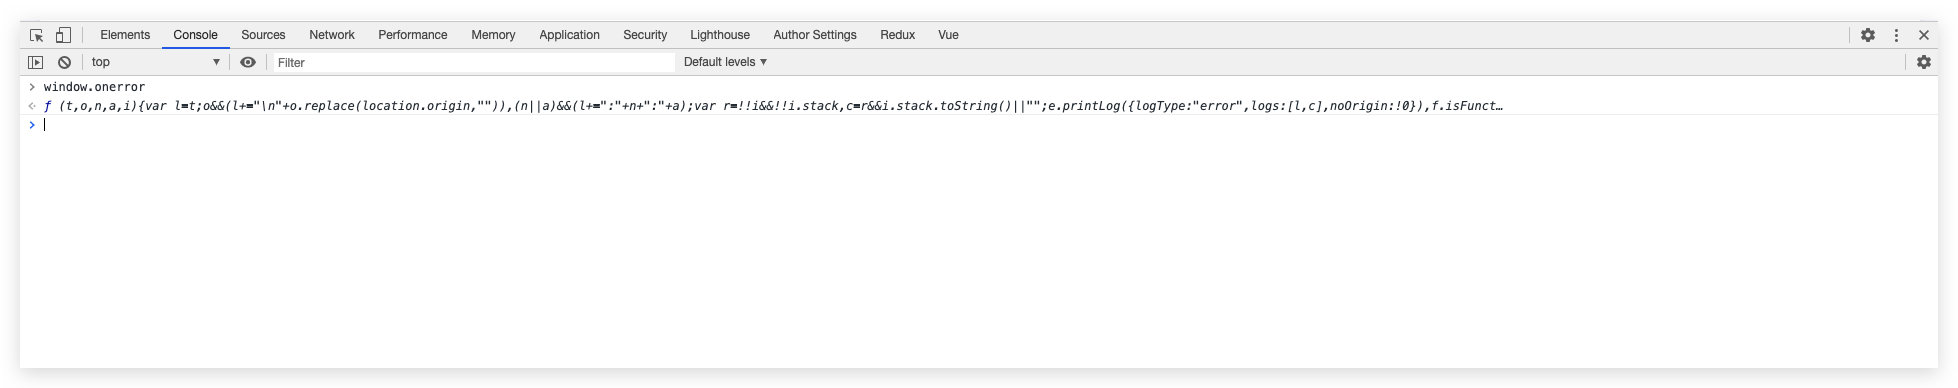
真有这个监听,而且还有『字符串 replace 操作』,这要是无限循环调用这个回调,分分钟卡死!顺手点击这个打印结果,直接跳转到引用它的代码:
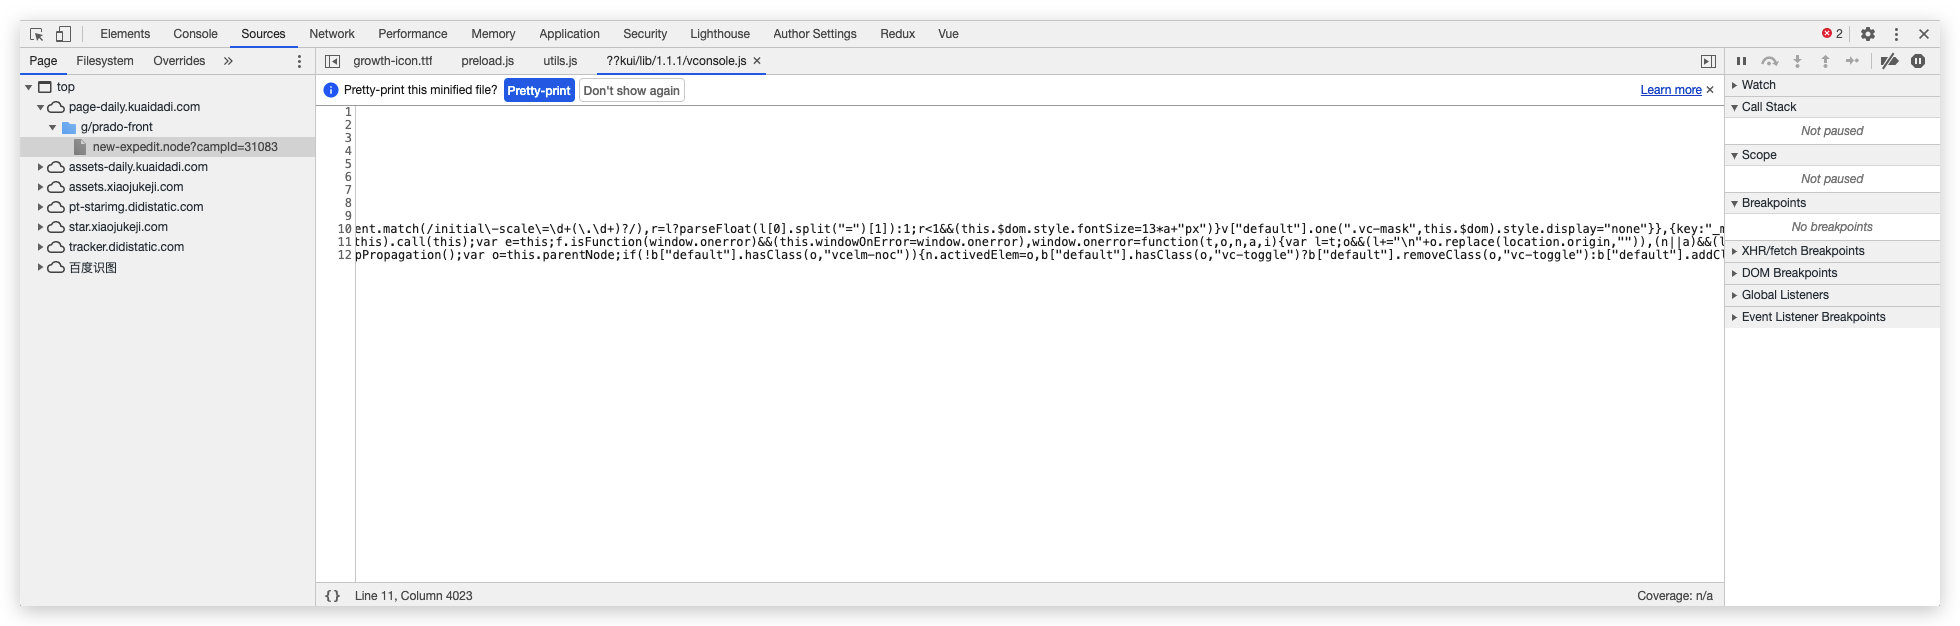
竟然是 vConsole 监听的,前端同学都知道,这个 vConsole 是为了在移动端方便调试使用的,一般在测试环境使用,所以这端代码很可能是这个导致了测试环境卡死,而线上环境正常的罪魁祸首!
四、验证
接下来我们就验证下猜想,首先把 window.onerror 覆盖为 console.log,重复复现步骤,控制台便打印出:
果不其然,不过这样还是卡住了,因为 console.log 也是同步操作。接着直接置空 window.onerror,执行 window.onerror = undefined,再来一次复现:
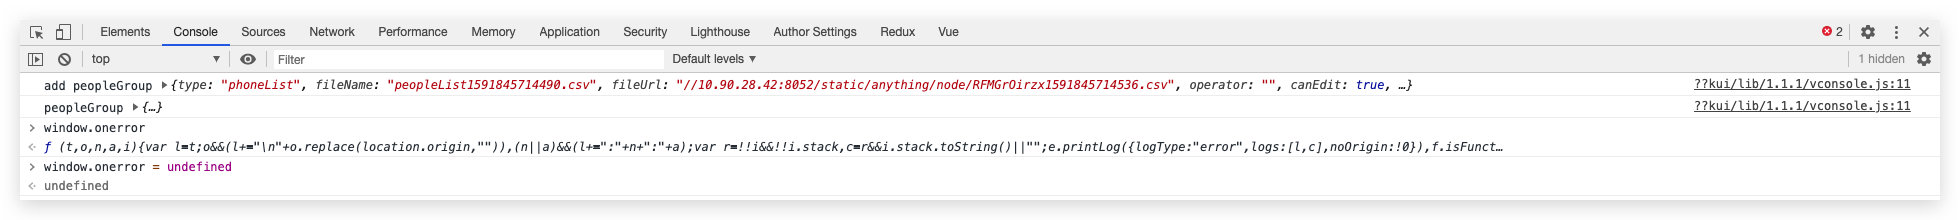
页面已经不再卡死了!
五、解决
目前在 Chrome 和 ele-element 未跟进解决的情况下,解决方法有:
- 去除 vConsole,毕竟中台项目不需要 vConsole;
- 置空 window.onerror;
- 对 window.onerror 进行节流;
六、总结
此处总结下遇到莫名卡死问题,排查步骤应简化为:
- 监听 window.onerror 事件,这样能把一些内部的报错(即不会在控制台显示的错误)直接打印到控制台中
- 使用监听 Chrome 日志方式打开浏览器,从日志中查看线索
- 合理推测和验证
Chrome 谜一样卡死的排查方法